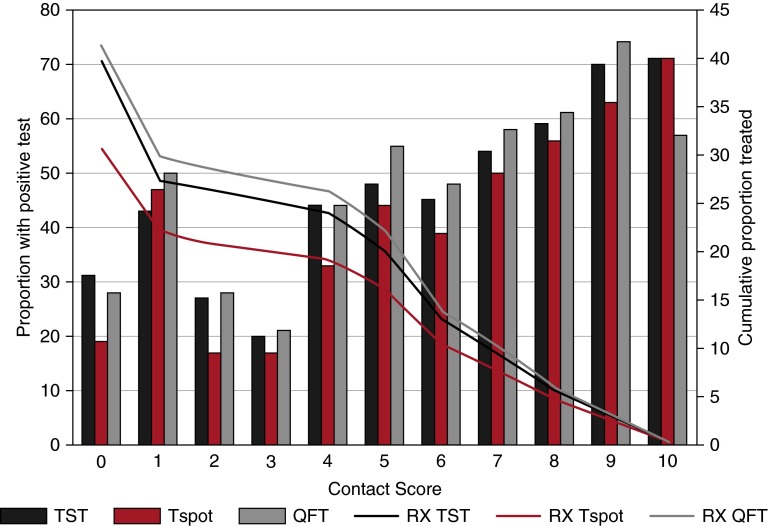
Figure 2.
Test positivity and treatment implications in relationship to contact score. Bars represent the proportion of children with respective positives test results along the continuum of exposure ranging from no known exposure (contact score = 0) to the highest level of exposure (contact score = 10). Lines demonstrate the cumulative proportion of children that would be offered IPT based on test positivity if contact score were considered a cut-point for IPT eligibility. If testing were used to guide IPT among children with a contact score greater than or equal to 2, TST, Tspot, and QFT would result in 26, 21, and 29% of children being offered treatment, respectively. In contrast, if testing were used to guide IPT among children with a contact score of greater than or equal to 5, TST, Tspot, and QFT would result in 20, 16, and 22% of children being offered treatment. Finally, if testing were used to guide IPT among children with a contact score greater than or equal than 10, no child would be treated because the highest contact score possible is 10. IPT = isoniazid preventive therapy; QFT = QuantiFERON; RX QFT = treatment guided by QFT response; RX Tspot = treatment guided by Tspot response; RX TST = treatment guided by TST response; Tspot = T-Spot.TB; TST = tuberculin skin test.

