Figure 4.

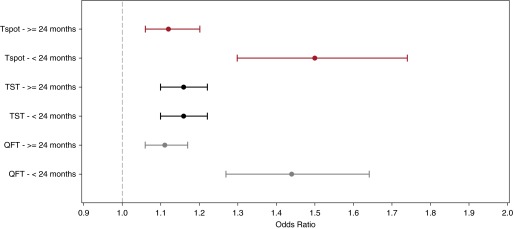
Odds ratio of test positivity in young children compared with older children. The figure compares the aOR of test positivity for each test in children younger than 24 months compared with children greater than or equal to 24 months. The aOR are indicated by the circles and the 95% confidence intervals are illustrated with the lines; Tspot in red, TST in black, and QFT in gray. For the QFT model and the Tspot, there were interactions between age and contact score. Hence, the association between the IFN-γ release assay results and contact score is most accurately measured within each of the respective age strata. The aOR of QFT positivity was higher for younger children (P < 0.001): children younger than 24 months, aOR of 1.44 (95% CI, 1.27–1.64) and children greater than or equal to 24 months, aOR of 1.11 (95% CI, 1.06–1.17). Similarly, the aOR of Tspot positivity was higher for younger children (P < 0.001): children younger than 24 months, aOR of 1.50 (95% CI, 1.30–1.74) and children greater than or equal to 24 months, aOR of 1.12 (95% CI, 1.06–1.20). For the TST model, there was no significant association between age and TST result. Therefore, the aOR of TST was 1.16 (95% CI, 1.10, 1.22) for children younger than and greater than or equal to 24 months. aOR = adjusted odds ratio; CI = confidence interval; QFT = QuantiFERON; Tspot = T-Spot.TB; TST = tuberculin skin test.
