Figure 1.

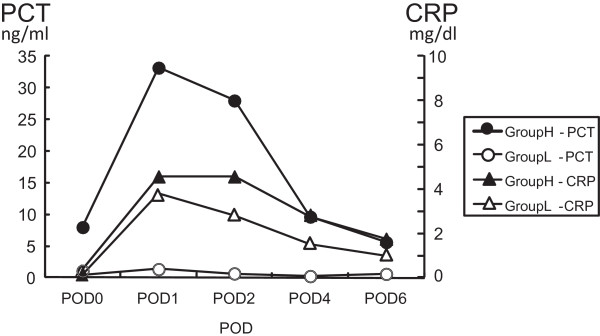
The changes over time in PCT and CRP until POD6. The mean values of PCT in group H became peak in the POD 1. There were not any significant differences between the two group's CRP levels in any days.

The changes over time in PCT and CRP until POD6. The mean values of PCT in group H became peak in the POD 1. There were not any significant differences between the two group's CRP levels in any days.