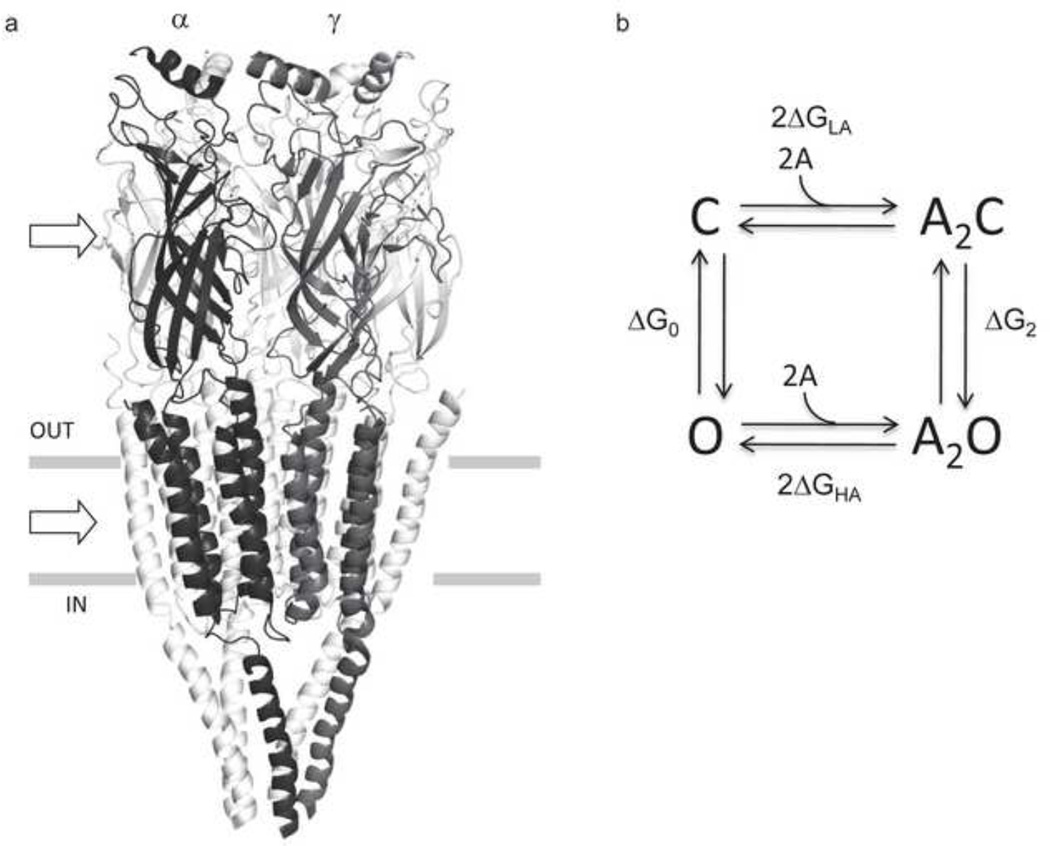
Figure 1. AChR structure and function.
a. The Torpedo marmorata AChR (subunit stoichiometry α2βδγ; pdb accession number 2bg9 83). In adult mouse AChRs an ε subunit replaces γ. The upper and lower arrows mark the levels of a transmitter binding site (at the subunit interface) and the gate region of the pore. b. Thermodynamic cycle for AChR activation. Horizontal arrows, binding to two equivalent binding sites (A, the agonist); vertical arrows, the gating conformational change (C and O, the closed- and open-channel ensembles of the system). ΔGO and ΔG2, the O vs. C energy difference without and with two agonist molecules bound; ΔGLA and ΔGHA, the free energy of binding, low and high affinity. From detailed balance, 2ΔGB=ΔG2-ΔG0, where ΔGB=ΔGHA-ΔGLA. ΔGB is the energy from the affinity change for one agonist that serves to increase the open-channel probability.

