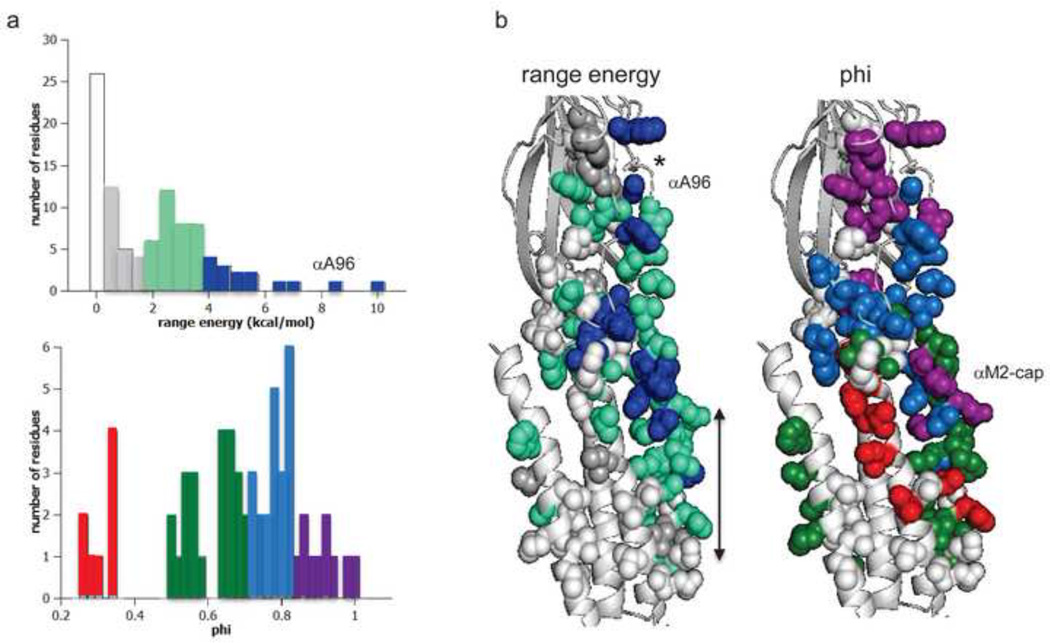
Figure 4. ΔG0 and phi in the α subunit.
a. Distributions. Top, range–energy is the difference between the smallest and largest ΔG0 for a series of mutations of one amino acid. ~15% of residues are iso-energetic between C and O (white). Bottom, phi is the slope of a log-log plot of the forward rate vs. gating equilibrium constant and gives the relative timing of energy change, early (purple) to late (red). There are ~4 phi populations. b. Maps (view is from the γ subunit interface). *, binding site; arrow marks the narrow region of the pore, alongside the M2 helix. Large range-energy residues are mainly along the subunit interface between the binding site and the gate, with some having ≥4 kcal/mol range (blue). There is approximately a decreasing, coarse-grained, longitudinal gradient in phi values. αA96 has the largest range-energy of any residue measured so far and a phi value that is lower than its neighbors. There is an isolated, large-range and high-phi patch of residues near the C-terminus of the M2 helix (the αM2-cap).

