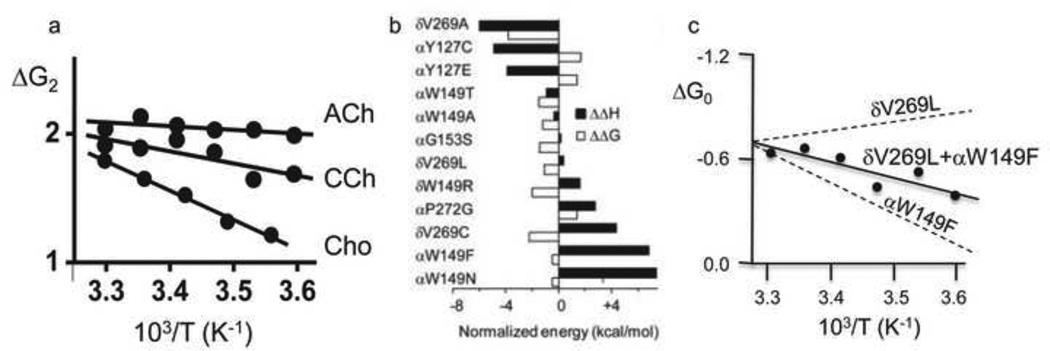
Figure 6. Temperature dependence of AChR gating.
a. The slope of the van’T Hoff plot (ΔG2 vs. 1/T) is agonist-dependent 86. b. The enthalpy change (black bars) associated with most mutations is larger than the free energy change (white bars) because of a compensating entropy change. c. An example where enthaply changes of mutations are approximately additive.

