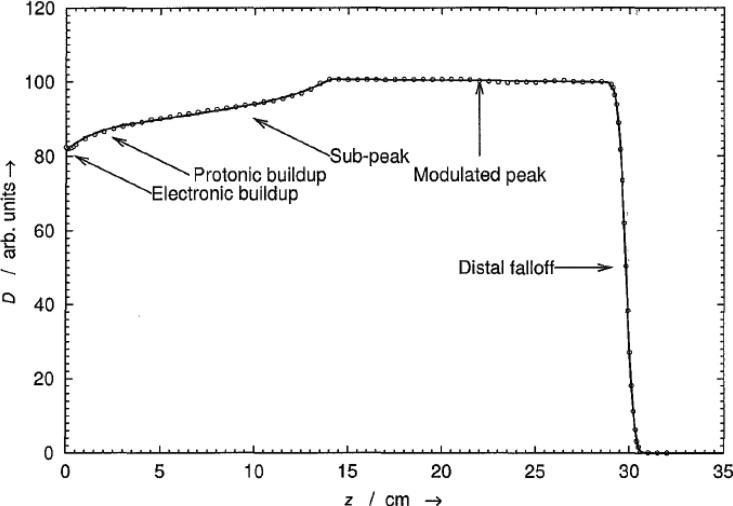
Figure 14.
Absorbed dose D as a function of depth z in water from a spread-out proton Bragg peak (SOBP). Various locations and regions that are indicated on the plot are defined in the text. This peak was measured with a Markus-type parallel-plate ionization chamber in the Northeast Proton Therapy Center (NPTC) gantry. The measured data are plotted with open circles and the model-fit as a solid line. Note that the electronic buildup region, which spans only a few millimeters, is not visible in this plot.

