
Figure 2.
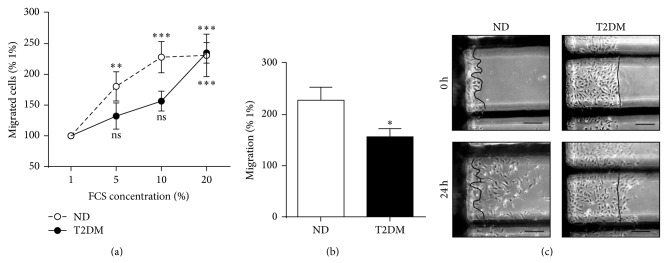
SV-EC migration. Confluent monolayers were quiesced and then wounded to create a cell-free area. Cells were cultured in medium containing 1–20% FCS and images taken at 0 and 24 h. The number of cells migrated past the wound edge were counted. (a) Concentration response to FCS, expressed relative to migration observed in 1% FCS (n = 9, ∗∗∗ P < 0.001, ∗∗ P < 0.01, ns = not significant relative to 1% migration). (b) Summary data of migration in media containing 10% FCS (n = 9, ∗ P < 0.05). (c) Representative images, scale bar = 100 μm. Cells can clearly be seen migrating past the wound edge at 24 h.