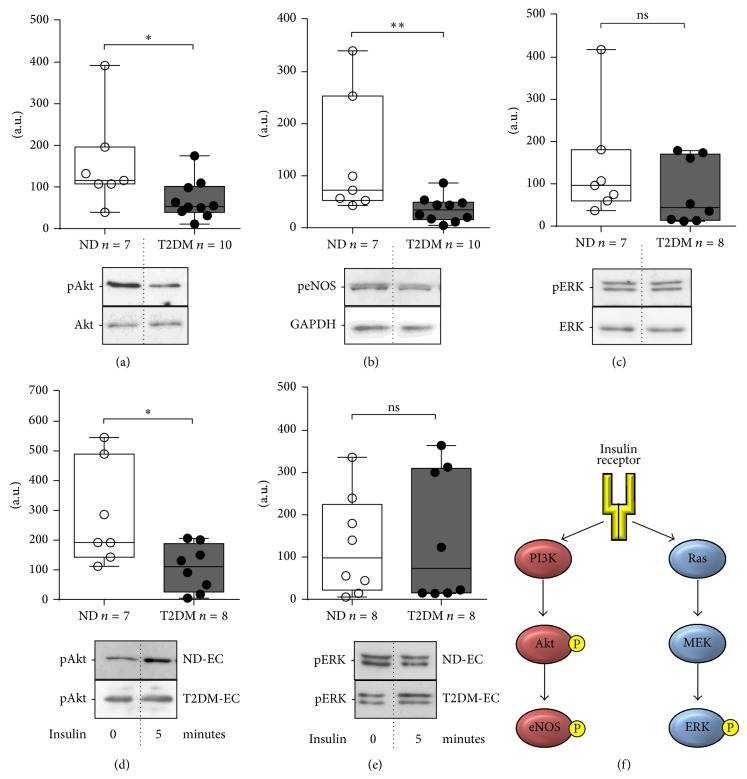
Figure 3.
Intracellular signalling in SV-EC. Cells were quiesced in MM (1% FCS) for 16 h and cell lysates immunoblotted for basal phosphorylation of (a) Akt, (b) eNOS, and (c) ERK. Data was normalised to a control lysate included on every blot and presented as box-and-whiskers with the median line indicated (upper panel), ∗∗ P < 0.01, ∗ P < 0.05, ns = not significant. Lower panels = representative western blots. Sensitivity to insulin was determined by treating quiesced cells with 100 nM insulin for 5 min. Cell lysates were immunoblotted for phosphorylation of (d) Akt and (e) ERK; ∗ P < 0.05, ns = not significant. Lower panels = representative western blots showing basal phosphorylation and in response to insulin. (f) Simplified diagram of the insulin signalling pathway. P = phosphorylation.

