Figure 4.
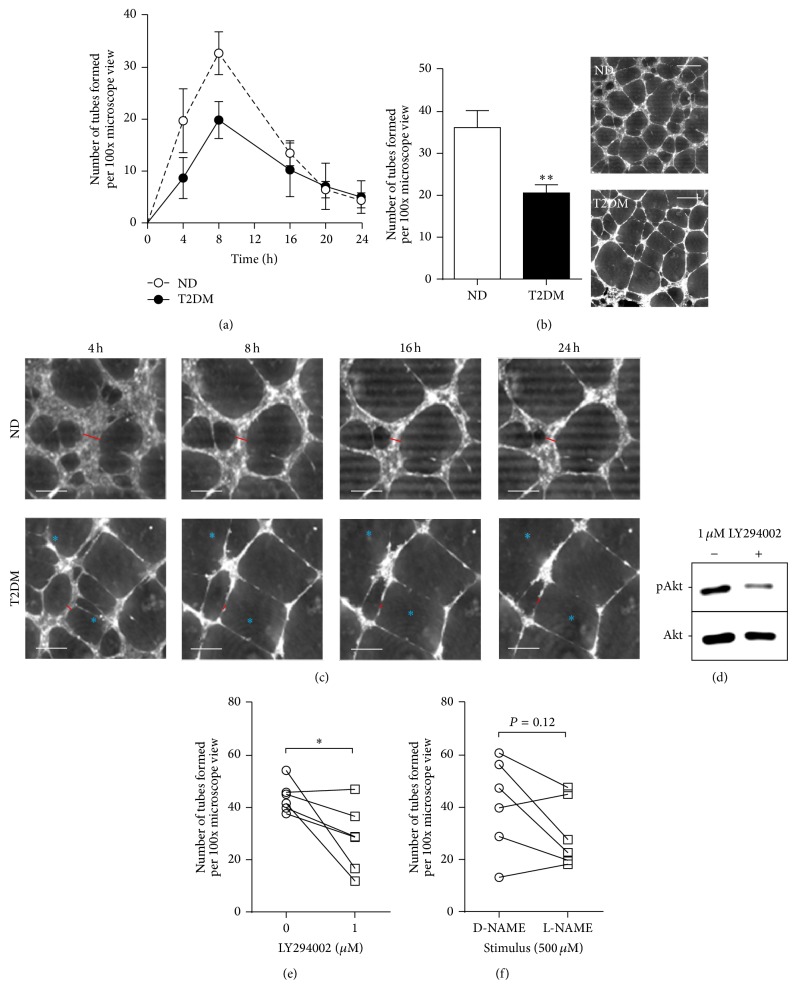
SV-EC angiogenesis. Angiogenesis assays were performed by seeding EC onto Matrigel and quantifying the number of tubes formed over time. (a) The number of intact tubes in 10 fields per population (×100 magnification) were quantified over 4–24 h by two independent observers (n = 4). (b) Number of intact tubes formed after 8 h (n = 7, ∗∗ P < 0.01) with representative images using the Phase Focus Virtual Lens (PFVL21). Scale bar = 500 μm. (c) Enlarged images showing the same field over extended time course. The width of tube walls is indicated by a red bar, and breakage of walls is indicated by blue asterisks (scale bar = 250 μm). (d) Cells were exposed to 1 μM LY294002 for 24 h and lysates were immunoblotted for phosphorylation of Akt. (e) ND-EC were treated with 1 μM LY294002 for 24 h prior to incorporation into angiogenesis assays and the number of intact tubes counted (n = 5, ∗ P < 0.05). (f) Similar experiments were performed after pretreatment with 500 μM L-NAME or control (D-NAME) (n = 5, P = 0.12).

