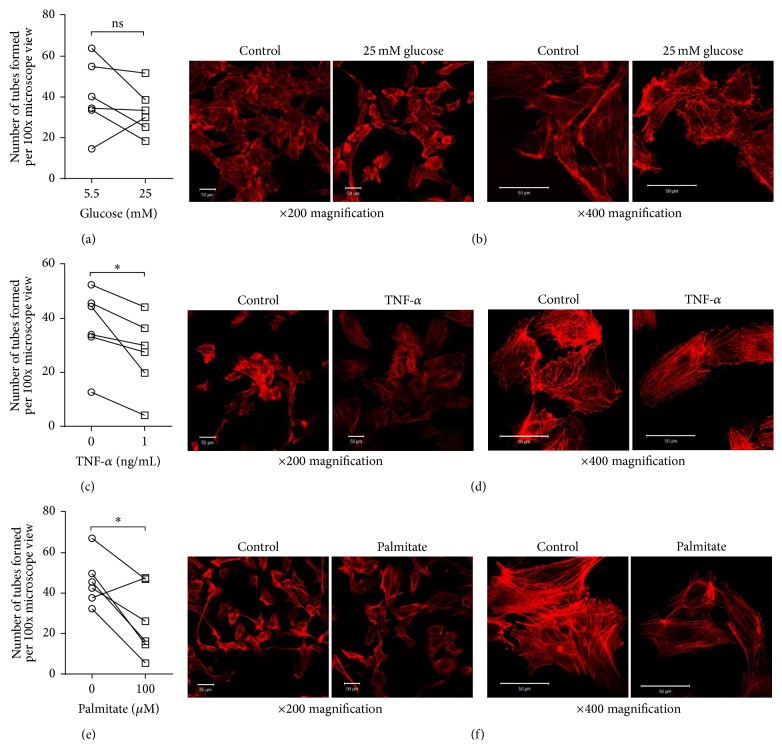
Figure 5.
Effect of “diabetic” stimuli on SV-EC function. (a) ND-EC were treated with 25 mM glucose (with mannitol as osmolarity control) for 24 h before performing angiogenesis assays and counting the number of intact tubes (n = 5). (b) Similarly treated cells were fixed and the F-actin cytoskeleton visualised using rhodamine phalloidin. Scale bars = 50 μm. (c) Parallel assays were performed on cells treated with 1 ng/mL TNF-α as an inflammatory stimulus ((c, d), n = 6, ∗ P < 0.05) and 100 μM palmitate to mimic an elevation in free fatty acids ((e, f), n = 6, ∗ P < 0.05).

