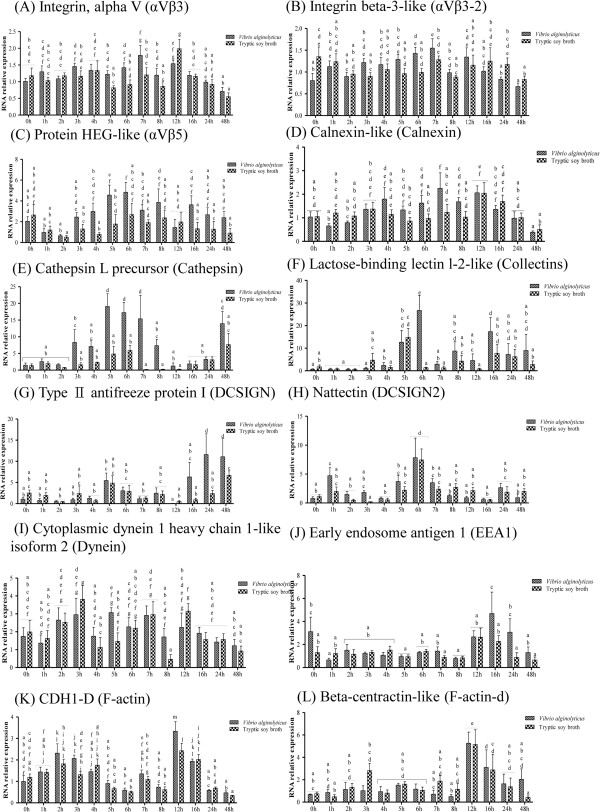
Figure 5.

Phagocytosis-related pathway gene expression in controls and grouper challenged with 1.3 × 10 6 CFU/ml (20 μl/fish) Vibrio alginolyticus , as determined by qRT-PCR. ( A ) αVβ3, ( B ) αVβ3-2, ( C ) αVβ5, ( D ) Calnexin, ( E ) Cathepsin, ( F ) Collectins, ( G ) DCSIGN, ( H ) DCSIGN2, ( I ) Dynein, ( J ) EEA1, ( K ) F-actin, and ( L ) F-actin-d. Values with different letters differ significantly. Values are presented as the mean ± SEM (n = 5). Significance was set at P < 0.05, as determined by one-way ANOVA followed by Duncan’s test.
