
Figure 5.
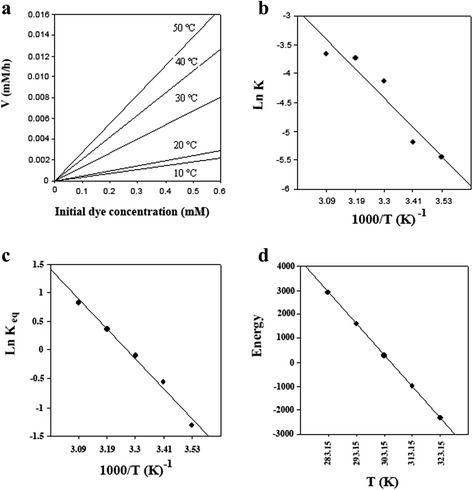
Energetic Study. a) dependence of decolorization rate on temperature (10–50°C), b) Arrhenius plot, c) van’t Hoff plot and, d) Gibbs free energy changes plot.
Official websites use .gov
A
.gov website belongs to an official
government organization in the United States.
Secure .gov websites use HTTPS
A lock (
) or https:// means you've safely
connected to the .gov website. Share sensitive
information only on official, secure websites.
Energetic Study. a) dependence of decolorization rate on temperature (10–50°C), b) Arrhenius plot, c) van’t Hoff plot and, d) Gibbs free energy changes plot.