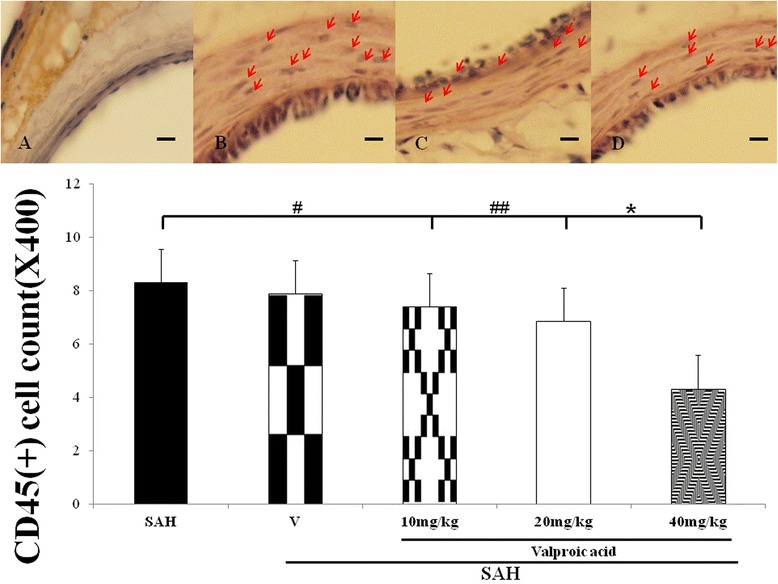
Figure 2.

Bar graph depicting VPA on the change of CD45 positive monocytes or microglia infiltrating in the wall of basilar artery after the induction of SAH. Toppanel revealed the sham-operated animals (A), the SAH group (B), 10 mg/kg/day VPA treatment in SAH rats (C) and Treatment with 40 mg/kg/day VPA in the SAH animals (D). Lower panel revealed the CD45(+) cell count among the experimental groups. Data in the figure are presented as mean ± SD (n = 9). *: P < 0.01, and #, ##: P > 0.01 when compared with the SAH group.
