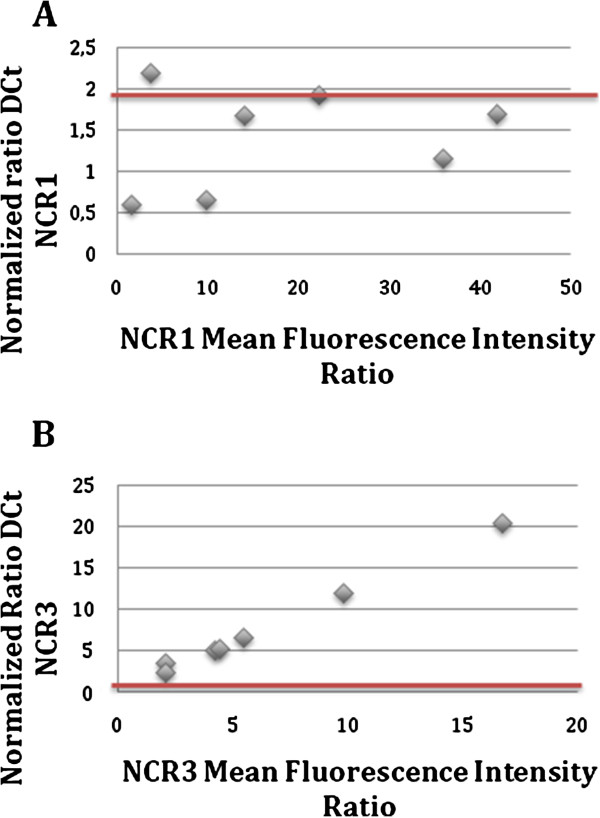
Figure 2.

RT-qPCR analysis of NKp46/NCR1 (panel A) and NKp30/NCR3 (panel B). Values fewer than 2 correspond to an RNA expression not statistically superior to the gene control, value above 2 correspond to over-expressed RNA. Data correspond the RNA levels ratios between 7 AIDS-RL samples versus 32 HIV-positive patients without lymphoma.
