
Figure 2.
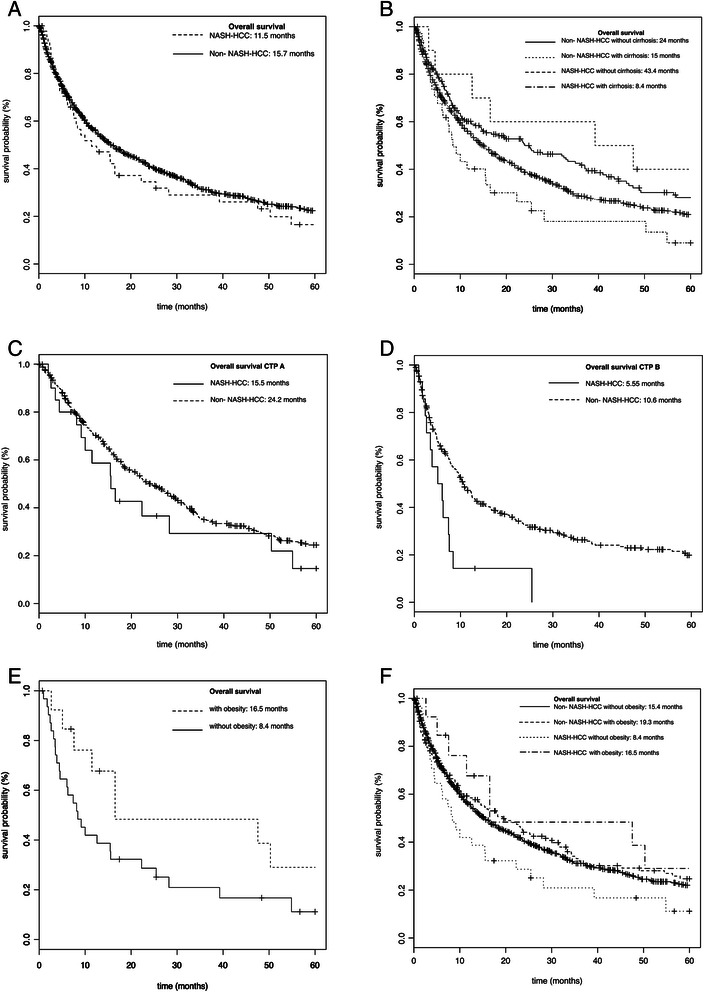
Kaplan-Meier survival curves. Kaplan-Meier survival curves comparing overall survival in NASH-HCC and non-NASH-HCC patients; A for all patients; B for all patients regarding presence of liver cirrhosis; C for all patients with Child Pugh stage A; D for all patients with Child Pugh stage B; E for all patients regarding obesity; F for NASH-HCC and non-NASH-HCC patients regarding obesity.