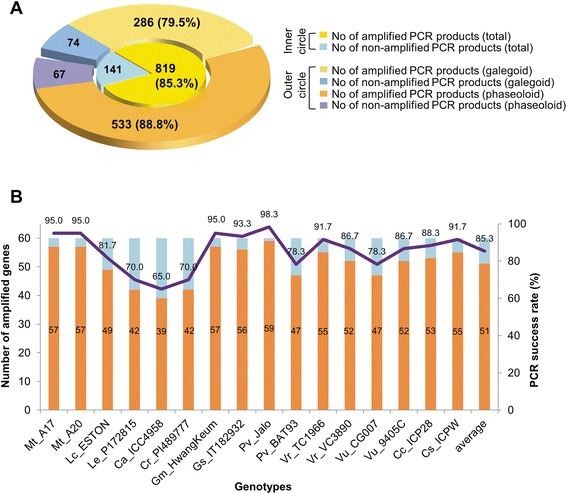
Figure 6.

Summary of cross-species amplification of 60 selected abiotic stress-responsive genes. A. PCR success rates of overall cross-species and cross-clade amplifications. B. PCR success rates according to 16 genotypes. Pale brown bars and numbers indicate the number of genes amplified out of 60 selected genes. Solid line and numbers denote percent success rate of PCR amplifications. Abbreviated species names are the same as in Figure 5.
