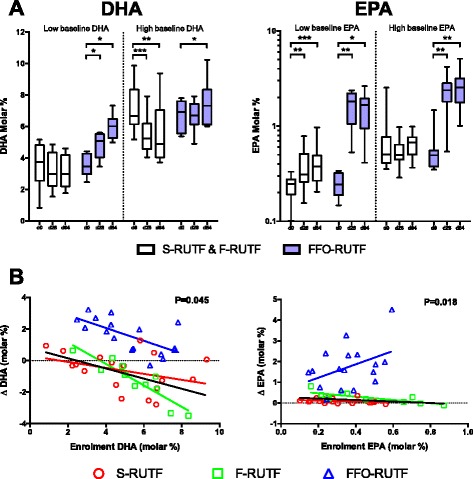
Figure 3.

Effect modification of baseline PUFA status on EPA and DHA enrichment in erythrocytes. (A) Erythrocyte DHA and EPA between both arms without fish oil (S-RUTF and F-RUTF) compared to FFO-RUTF. Participants are stratified on the basis of their baseline DHA or EPA values. Low indicates equal to or below the median, and high indicates above the median. *P ≤0.05; **P ≤0.01; ***P ≤0.001 (by sign test). (B) Change in erythrocyte DHA or EPA from baseline to day 84 plotted against baseline DHA or EPA. Regression lines are colored the same as corresponding group symbols, black regression line is for S-RUTF and F-RUTF combined. P value is for effect modification across the three arms as described in the text.
