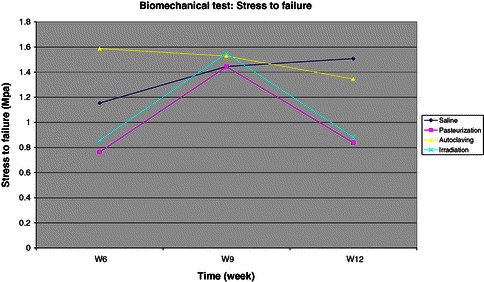
Figure 5.

Chart for stress to failure under compression test. Shows similar pattern seen in the maximum load under compression test (see Figure 4). The control group is increasingly getting stronger towards the end of the study at week 12 as the grafts become incorporated and united. All sterilized bone grafts become weaker towards the end of the study at 12 weeks compared to the control group.
