
Fig 10.
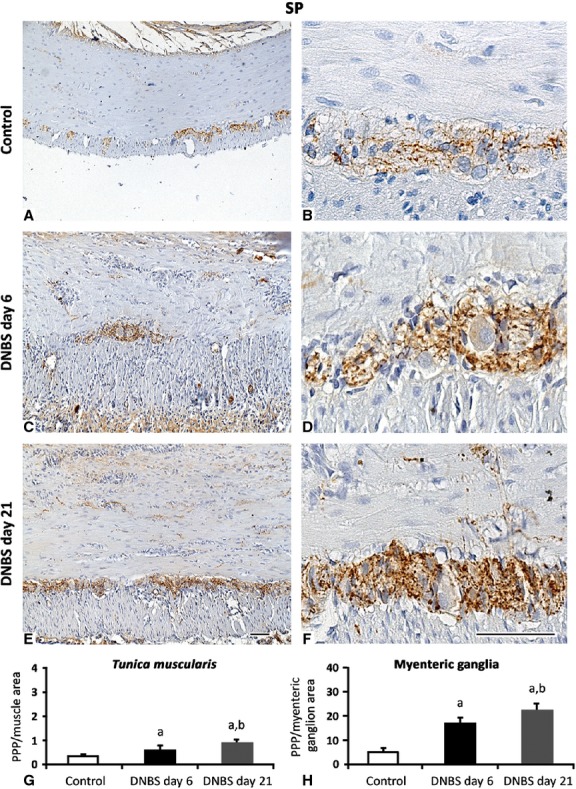
Representative pictures of SP immunostaining in colonic tunica muscularis and myenteric ganglia from control rats (A and B) or animals with DNBS-induced colitis at day 6 (C and D) and day 21 (E and F). Note the increase in SP positivity within the muscle layers and myenteric ganglia over the two time-points; scale bars = 50 μm. (G and H) Quantitative estimation of SP expression was obtained by image analysis and expressed as percentage of positive pixels (PPP) calculated on the whole tunica muscularis (G) or myenteric ganglionic (H) area examined. Column graphs show mean values of PPP ± SD obtained from six rats. aP ≤ 0.05 versus controls; bP ≤ 0.05 versusDNBS day 6.