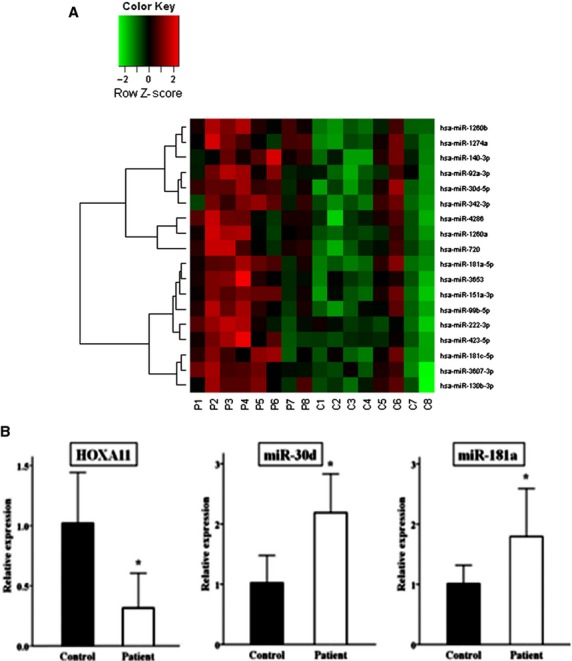
Fig 1.

MiRNA expression profiles in the USLs. Microarray revealed that eighteen miRNAs were overexpressed in POP patients compared with controls (n = 8/group), as shown in the form of heatmaps (A). qRT-PCR analyses of two miRNAs and HOXA11 expression in the USLs (B). The expression of miR-30d and 181a was significantly increased in women with POP (n = 30) compared to controls, whereas HOXA11 mRNA expression was significantly decreased in POP patients versus controls (n = 30/group). Quantitative data representing the mean ± SD are presented in the bar graph. *P < 0.01 compared with expression in the USLs from the controls.
