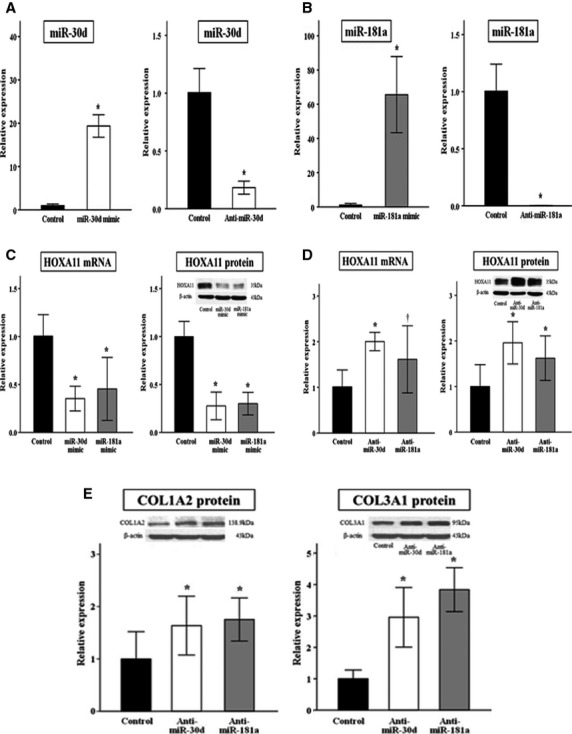
Fig 3.

Effects of the overexpression and knockdown of miR-30d or 181a on the expression of HOXA11. qRT-PCR analysis for miR-30d (A) or 181a (B) in 293T cells transfected with a specific miRNA mimic or anti-miRNA, indicating the successful overexpression or knockdown. Transfection with miR-30d or 181a mimic decreased HOXA11 mRNA and protein levels (C). Conversely, transfection with anti-miR-30d or 181a resulted in an increase in HOXA11 levels (D) and collagen production (E). Each experiment was conducted in triplicate. Quantitative data representing the mean ± SD are presented in the bar graph. *P < 0.01, †P < 0.05 compared with negative controls. Note that the left and right graph on E have different scales on the Y-axis.
