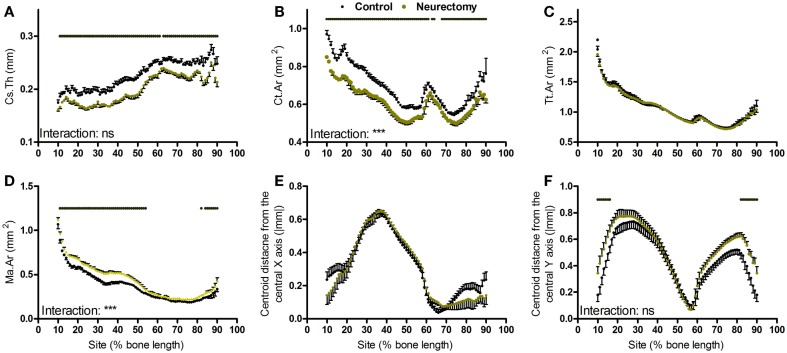
Figure 4.
Analysis of response of the mouse tibia to neurectomy-induced disuse at each site along the bone’s length. Site specificity analysis of (A) Cs.Th, (B) Ct.Ar, (C) Tt.Ar, (D) Ma.Ar, (E) absolute anterior–posterior, and (F) medial–lateral centroid deviation calculated from control left tibiae and disused right tibiae from the same mice, n = 6. Dots/bars above the graphs indicate sites of significant difference, p < 0.05 following Bonferroni correction. Interactions are the site by neurectomy interactions calculated by mixed models; ns not significant, ***p < 0.001.

