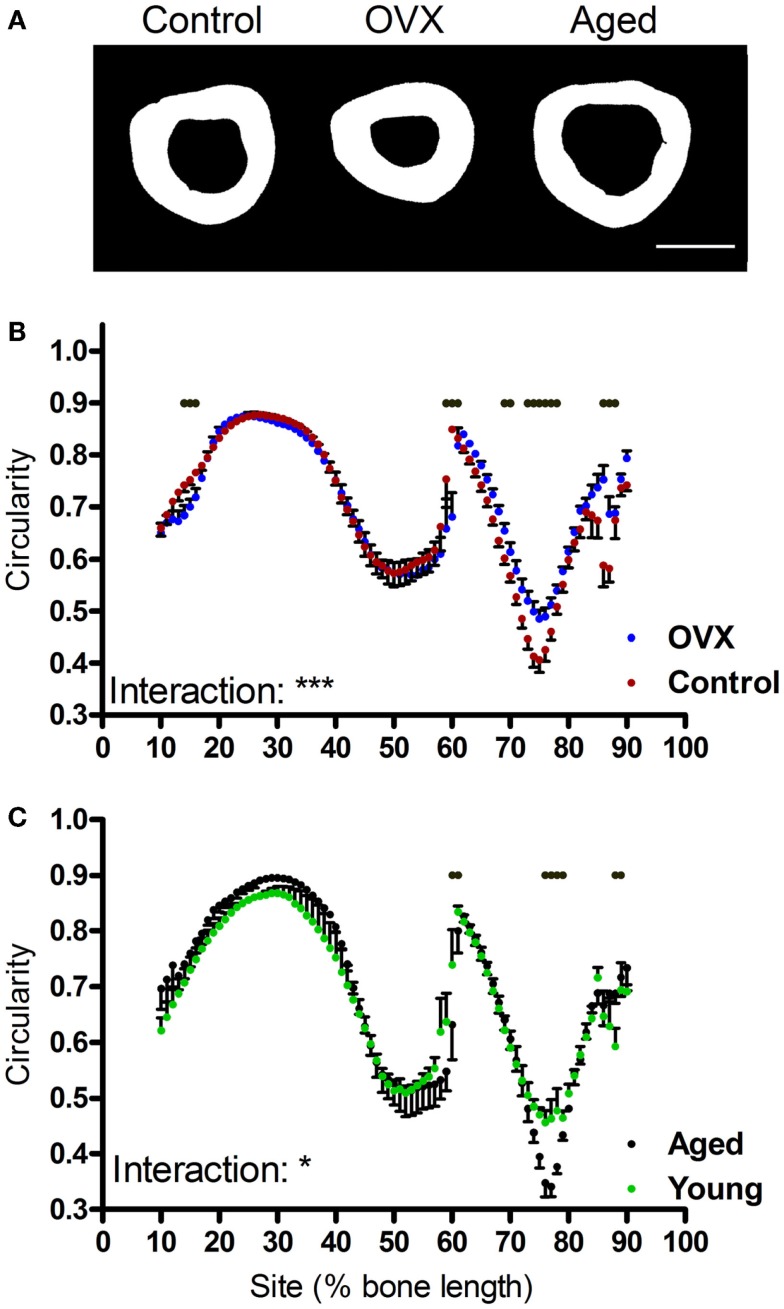
Figure 7.
Effects of ovariectomy and aging on the eccentricity of the mouse tibia at each site along the bone’s length. (A) Representative binarized images of the cross-sections through the 75% site of the tibia from a young control mouse, an ovariectomized mouse, and an aged mouse. (B,C) Eccentricity calculated from left tibiae of (B) non-ovariectomized control mice and left tibiae from ovariectomized mice or (C) young or aged mice, n = 6. Dots/bars above the graphs indicate sites of significant difference, p < 0.05 following Bonferroni correction. Interactions are the site by ovariectomy interactions calculated by mixed models; *p < 0.05, ***p < 0.001.

