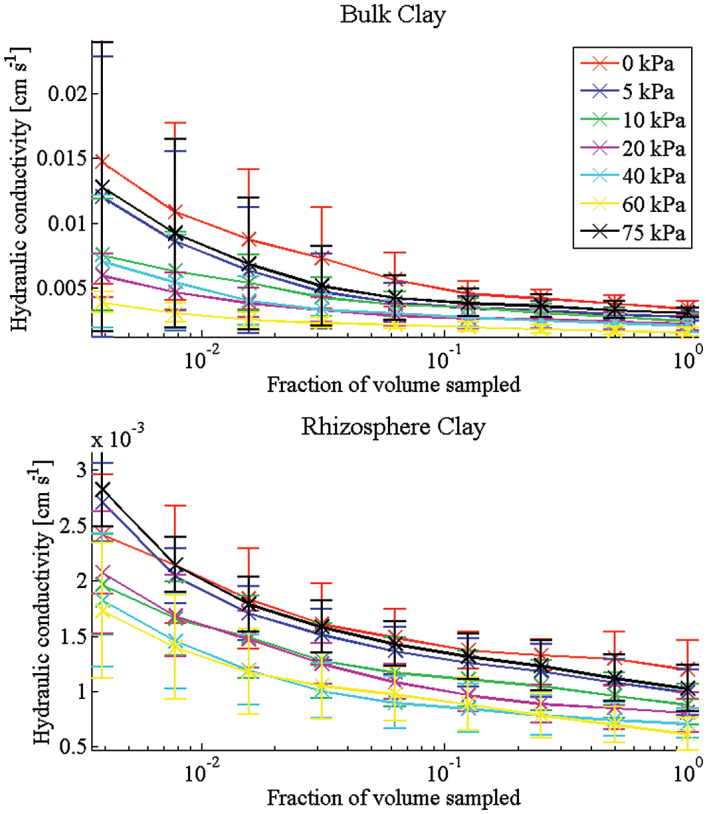
Fig. 4.
Convergence plots for clay soil. For each case (rhizosphere and bulk), three samples were taken. From each of these, six subsamples were obtained. These plots show the average and standard deviation over the 18 subsamples for increasing subsample size. (This figure is available in colour at JXB online.)

