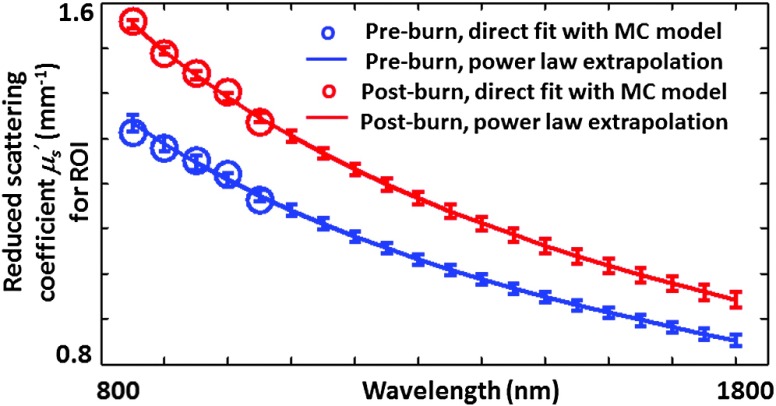
Fig. 1.
Reduced scattering spectra of rat tissue preburn (blue) and postburn (red), with extrapolated (850 to 1800 nm) power-law reduced scattering spectra (solid curves) plotted alongside reduced scattering coefficient values obtained directly by pixel-by-pixel fitting (circles) with a Monte Carlo model for the wavelengths from 850 to 1050 nm. The error bars represent the standard deviation of the extrapolated reduced scattering coefficient over the region of interest. The error bars for the direct-fit scattering coefficient are not pictured, as they are within the diameter of the circles.

