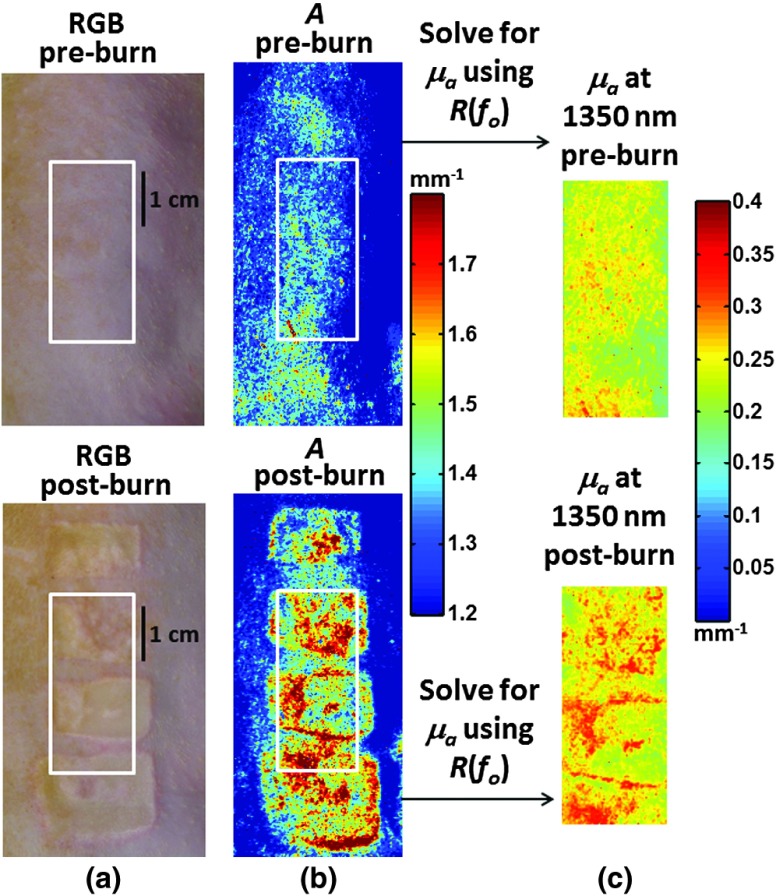
Fig. 2.
(a) Digital color images (preburn and postburn) of the region of the rat that was contacted with the burn comb. (b) Map of reduced scattering amplitude (preburn and postburn), from extrapolated power-law fit to reduced scattering coefficient obtained with SFDI from 850 to 1050 nm, over the region of the rat that was contacted with the burn comb. (c) Map of absorption coefficients at 1350 nm (preburn and postburn), over the subregion denoted by the white box in the color images and scattering amplitude maps, obtained by using the extrapolated reduced scattering coefficient and the unstructured illumination reflectance data at 1350 nm.

