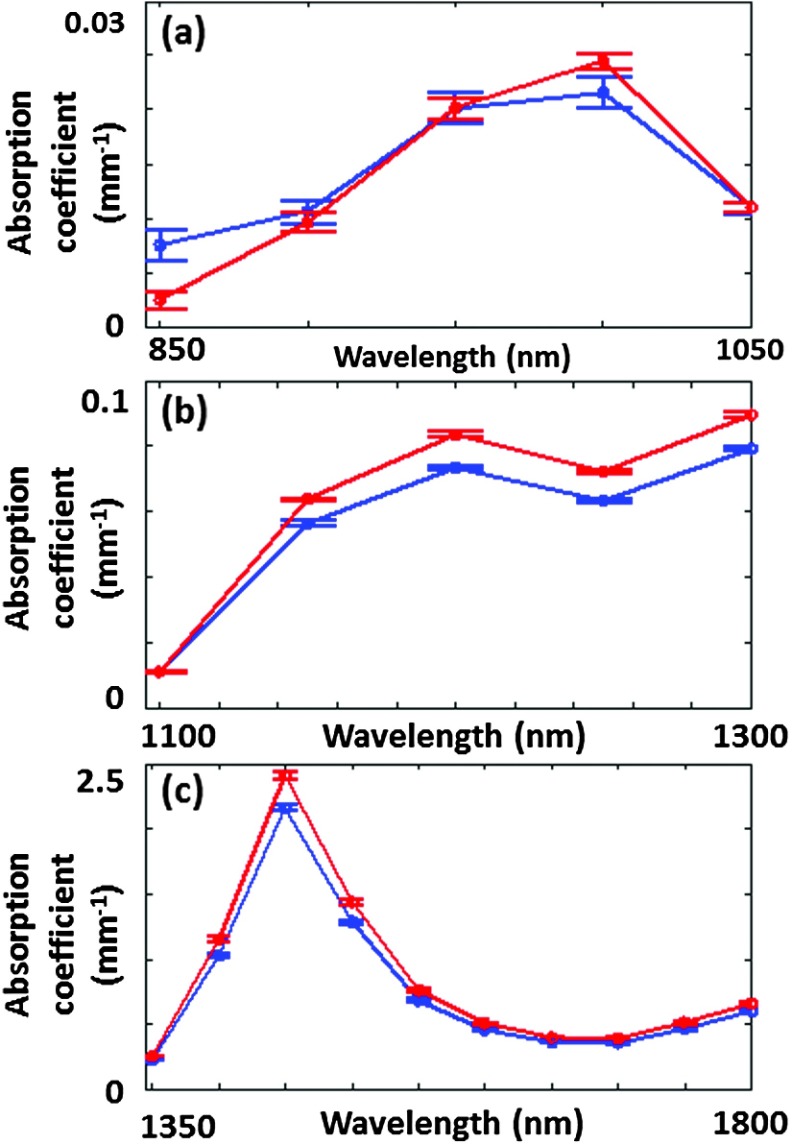
Fig. 3.
(a) Mean extracted absorption coefficients from 850 to 1050 nm for rat tissue preburn (blue) and postburn (red) for the region of interest shown in Fig. 2. (b) Same as (a) but for 1100 to 1300 nm. (c) Same as (a) and (b) but for 1350 to 1800 nm. For all three panels, the error bars represent the standard deviation of the absorption coefficient over the region of interest.

