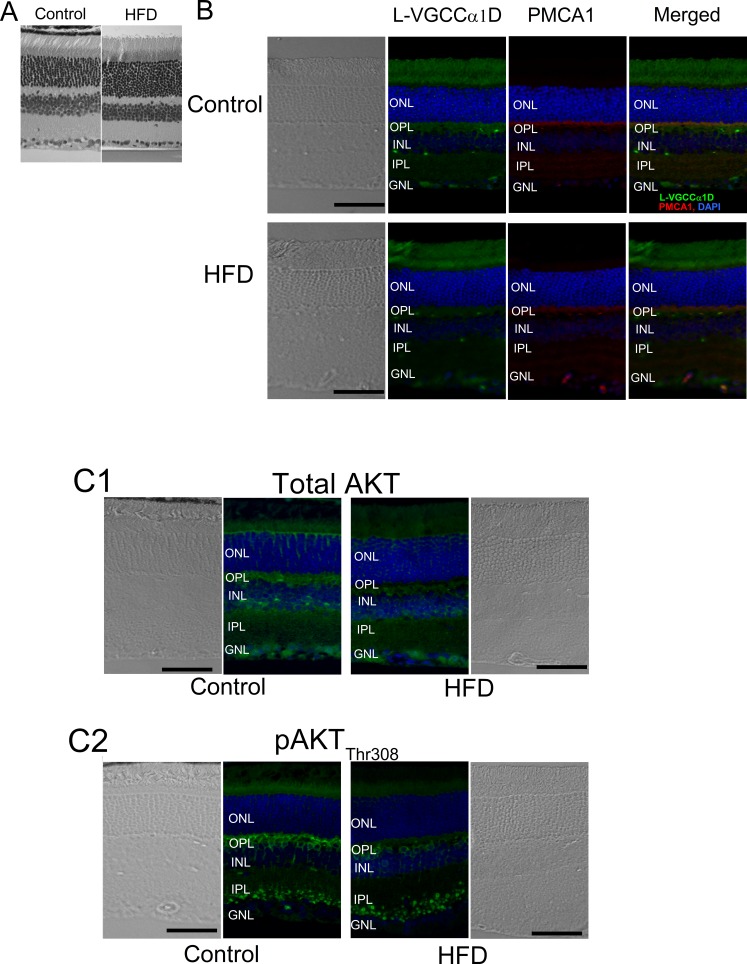
Figure 5.
The immunofluorescent intensities of several proteins are altered in the retina of HFD mice. Mouse retinal sections (4 μm) were processed for immunofluorescence staining. (A) There is no significant difference in overall morphology between the control and HFD mouse retina with hematoxylin and eosin (H&E) staining. (B) The fluorescent intensities of L-VGCCα1D and PMCA1are dampened in the retina of HFD mice. Green: L-VGCCα1D. Red: PMCA1. Blue: DAPI. (C) Total AKT (C1), and pAKTthr308 (C2) are also dampened in the retina of HFD mice. Blue: DAPI. Green: Total AKT (C1) or pAKTthr308 (C2). Scale bars: 50 μm. GCL, ganglion cell layer; INL, inner nuclear layer; ONL, outer nuclear layer.

