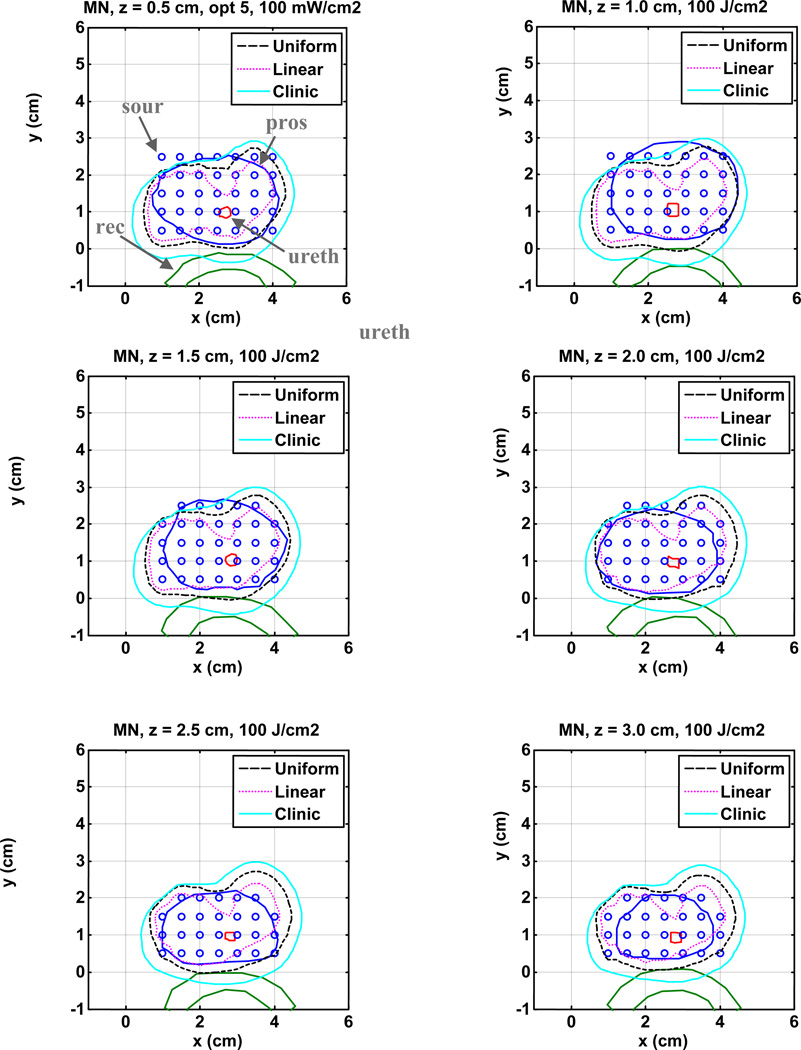
Figure 5.
Comparison of 100% isodose lines of light fluence rate in the heterogeneous prostate among three cases: ignoring clinic PS drug distribution (dashed line); including clinical PS drug distribution (solid line); and using linear PS drug distribution (dotted line). The source strengths are listed in Table 1.

