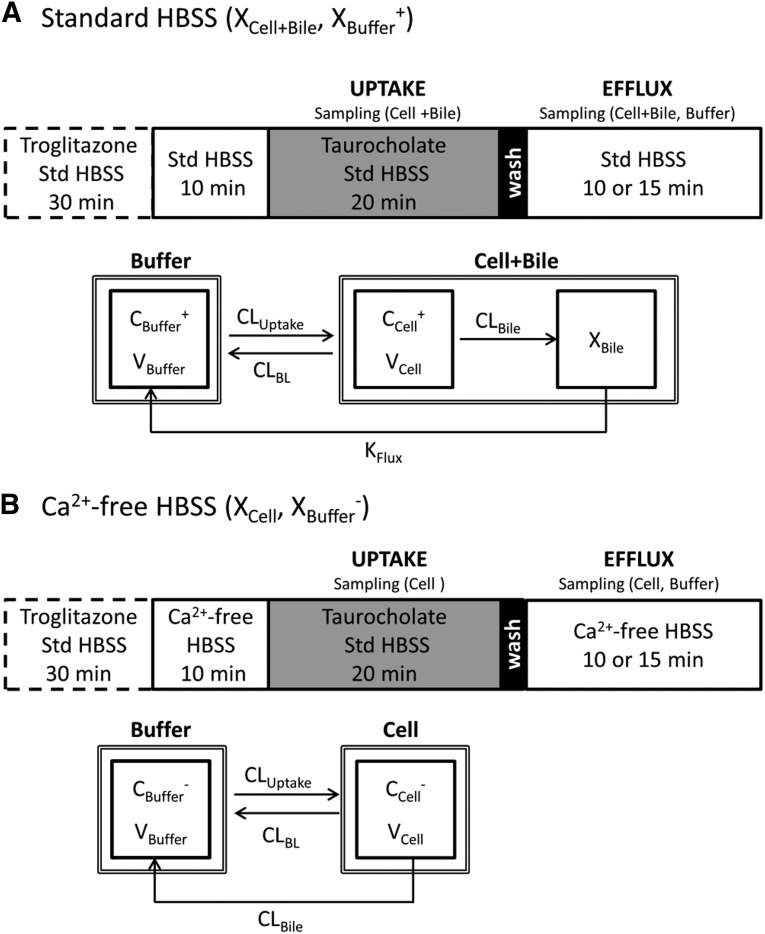
Fig. 1.
Schemes depicting the uptake and efflux protocol and the mechanistic model of [3H]TCA disposition in SCH. (A) Uptake and efflux studies were conducted in the presence of standard (+Ca2+) Hanks’ balanced salt solution (Std HBSS). Tight junctions remained sealed throughout the study period. (B) Tight junctions remained open throughout the study period by preincubating with Ca2+-free HBSS, then performing an uptake phase in standard HBSS to provide relief from the removal of Ca2+, followed by a brief wash and efflux in Ca2+-free HBSS. In the uptake and efflux protocols, the dashed box represents preincubation with 10 µM TGZ in standard HBSS for TGZ-treated groups. Gray shading represents inclusion of the substrate, 1 µM [3H]TCA, in standard HBSS during the uptake phase. Black shading represents 1-minute wash followed by 10- (human SCH) or 15-minute (rat SCH) efflux phase in standard or Ca2+-free HBSS. In the model schemes, X, V, and C denote the mass of TCA, compartmental volume, and TCA concentration, respectively. Subscripts on mass, volume, and concentration terms denote the corresponding compartment in the model scheme. Superscripts represent the presence (+, intact tight junctions; cells + bile) and absence (−, modulated tight junctions; cells) of Ca2+ in the preincubation and efflux buffer. CLuptake, CLBL, and CLBile represent clearance values for uptake from buffer into hepatocytes, efflux from hepatocytes into buffer, and canalicular excretion from hepatocytes, respectively. KFlux represents the first-order rate constant for flux from bile networks into buffer.

