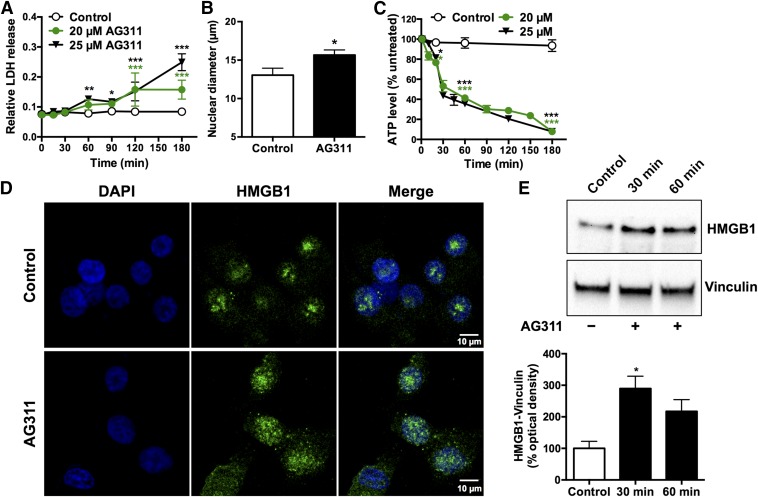
Fig. 2.
AG311 induces characteristics of necrotic cell death. (A) LDH release from AG311-treated MDA-MB-435 cells (n = 4). (B) Average measurement of nuclear diameter of AG311-treated (25 µM) MDA-MB-435 cells for 20 minutes (n = 8–11). (C) Time course of ATP levels in AG311-treated MDA-MB-435 cells (n = 4–5). (D) Immunofluorescence images of MDA-MB-435 cells treated with AG311 (25 µM) for 20 minutes. Images representative of three separate experiments. (E) Immunoblot of HMGB1 levels in cell lysate (cytosolic fraction) collected form AG311-treated (25 µM) MDA-MB-435 cells and solvent control. Graphs show quantification of HMGB1 levels normalized to vinculin. *P < 0.05, **P < 0.01, ***P < 0.001 versus solvent (0.2% DMSO).

