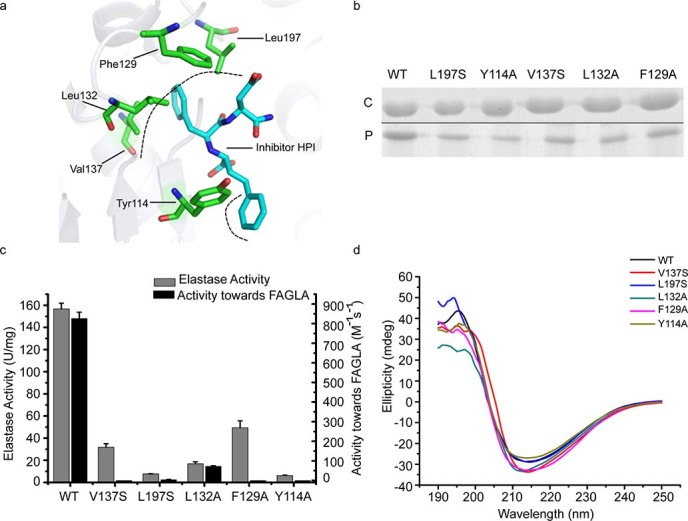
Figure 6. (a) Top view of the interaction of pseudolysin with the inhibitor HPI based on the structure of complexes between pseudolysin and HPI (PDB id: 1U4G).

Black dashed lines represent the hydrophobic interactions. (b) SDS-PAGE analysis of the binding ability of pseudolysin and its mutants to insoluble elastin. ‘C’ represents the pseudolysin mixed with insoluble elastin in the experiment, and ‘P’ refers to the pseudolysin released from the precipitated insoluble elastin. (Full-length gel is presented in Supplementary Fig. S3). (c) Enzymatic activities of pseudolysin and its mutants towards elastin and FAGLA. The graph shows data obtained from triplicate experiments (mean ± S.D.). (d) CD spectra of pseudolysin and its mutants.
