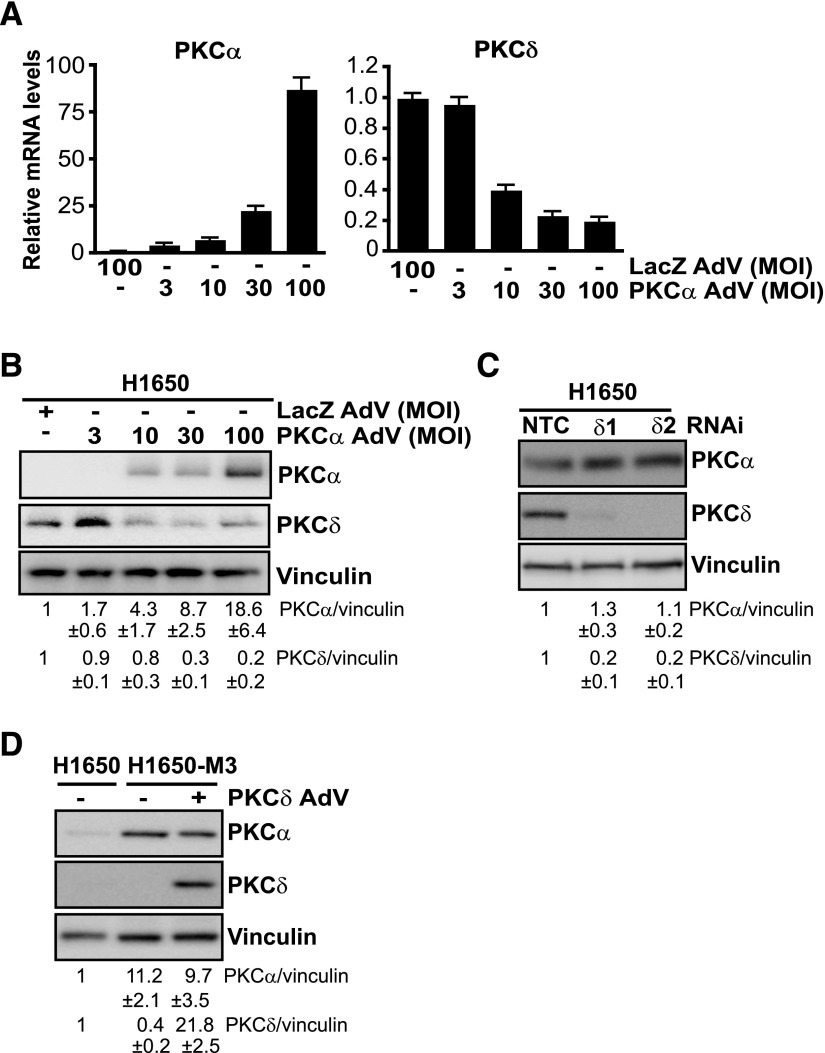
Fig. 4.
PKCα modulates the expression of PKCδ in H1650 cells. (A) H1650 cells were infected with either PKCα AdV or LacZ AdV at the indicated MOIs. PKCα and PKCδ mRNA levels were determined by qPCR 72 hours after infection. Data are expressed as the mean ± S.D. of triplicate samples. Results are expressed as the fold change relative to LacZ AdV. (B) Expression of PKCα and PKCδ was determined by Western blot 72 hours after infection with either PKCα AdV or LacZ AdV. (C) Parental H1650 cells were transfected with either PKCδ (PKCδ1 or PKCδ2) or NTC RNAi duplexes. PKCα and PKCδ levels were analyzed 72 hours later by Western blot analysis. (D) H1650-M3 cells were infected with either PKCδ AdV or LacZ AdV (MOI = 100 pfu/cell). PKCδ and PKCα levels were analyzed 96 hours later by Western blotting. Similar results were observed in three independent experiments. Densitometric analysis is shown as the mean ± S.D. (n = 3). NTC, nontarget control.

