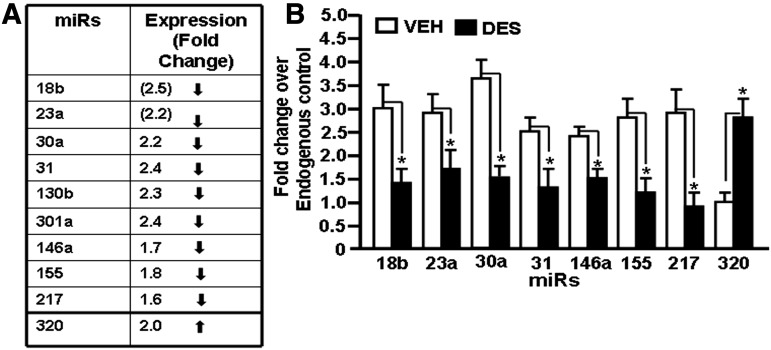
Fig. 4.
Validation of expression profile of selected miRs in fetal thymi postprenatal exposure to DES. Based on the expression profile obtained from miR arrays, eight miRs (seven downregulated and one upregulated) were selected for validation. Real-time PCR using mouse-specific miR assays was performed. In (A), the miR expression profile from miR arrays is depicted. (B) Expression profile of selected miRs (miR-18b, miR-23a, miR-30a, miR-31, miR-146a, miR-155, miR-217, and miR-320) in fetal thymi post-DES exposure was determined using miR-specific primers and by performing real-time PCR. Data are depicted as mean ± S.E.M. of three independent experiments. The asterisk (*) in (B) indicates a statistically significant (P < 0.05) difference between the groups compared.

