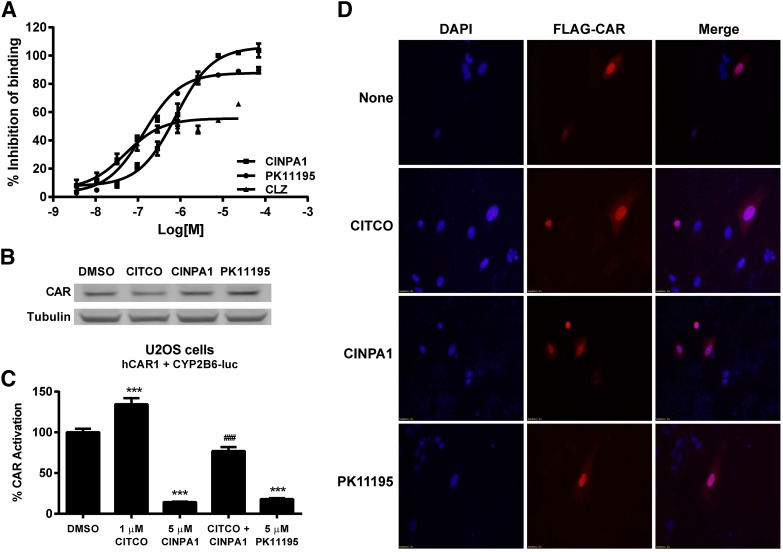
Fig. 6.
CINPA1 does not reduce protein levels or alter nuclear localization of CAR. (A) CAR binding to PGC-1α coactivator peptide was determined by using the LanthaScreen fluorescent coregulator peptide assay. Fluorescein-labeled PGC-1α peptide (125 nM) was complexed with GST-hCAR-LBD (5 nM) and Tb-anti–GST antibody (5 nM) as described in experimental procedures. Compounds (CLZ, PK11195, or CINPA1) at concentrations ranging from 70 µM to 3.5 nM (1:3 dilutions for 10 concentration levels) were used along with DMSO as a negative control, and CLZ (42 µM) was used as a positive control. % Inhibition of binding was calculated for each treatment, and the data were normalized to the positive control (42 µM CLZ, 100% inhibition) and negative control (DMSO, 0% inhibition). (B) Human primary hepatocytes (donor 8) were treated with DMSO, 1 µM CITCO, 5 µM CINPA1, or 5 µM PK11195 for 48 hours. Lysates were prepared, and CAR expression was analyzed by Western blot using anti-CAR monoclonal antibody (clone N4111). Tubulin was used as a loading control. Data shown are representative of at least three hepatocyte donors tested. (C) U2OS cells were transiently transfected with plasmids expressing FLAG-hCAR1, CYP2B6-luc reporter, and control plasmid pTK-RL. After 24-hour incubation, cells were treated with DMSO (control), 1 µM CITCO, 5 µM CINPA1, 1 µM CITCO + 5 µM CINPA1, or 5 µM PK11195. Dual luciferase activity was measured 24 hours after treatment. Renilla luciferase was used to normalize firefly luciferase values, and % CAR activation was calculated by setting DMSO to 100%. Statistical significance was determined using one-way analysis of variance for comparisons between multiple treatment groups. ***P < 0.001 compared with DMSO treatment; ###P < 0.001 comparing CITCO + CINPA1 with CITCO-treated cells. (D) U2OS cells were transfected to express FLAG-hCAR1. Cells were treated with indicated chemicals for 2 hours before fixing and staining with anti–FLAG-M2 antibody (Sigma-Aldrich). Secondary antibody labeled with Alexa Fluor 555 dye was used to visualize FLAG-tagged hCAR1 (red) using a Nikon C1Si microscope. Nuclei were stained with 4′,6-diamidino-2-phenylindole (DAPI) (blue).

