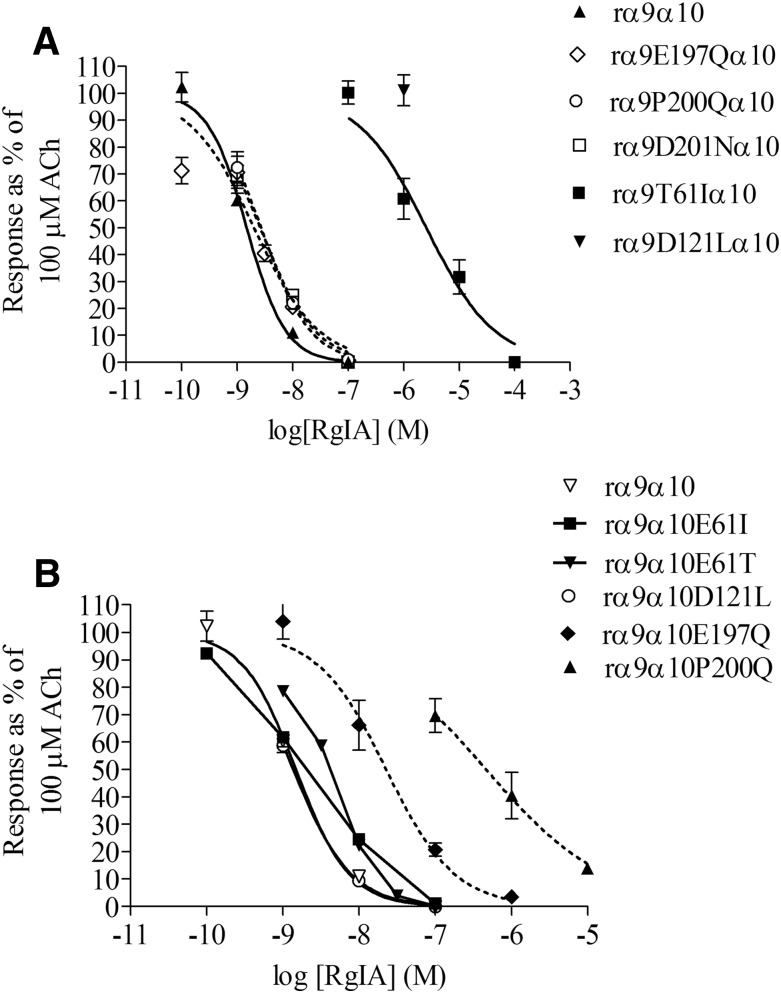
Fig. 2.
Dose-response curves for α-CTx RgIA block of wild-type and mutant α9α10 nAChRs. (A) Mutation of (+) face residues in the α9 subunit did not affect α-CTx potency, whereas mutations in the (−) face residues decreased the potency of α-CTx RgIA. (B) Mutations of the (+) residues of the α10 subunit decreased α-CTx RgIA potency, whereas mutations of the (−) face residues did not. Values are mean ± S.E.M. from at least three different oocytes.

