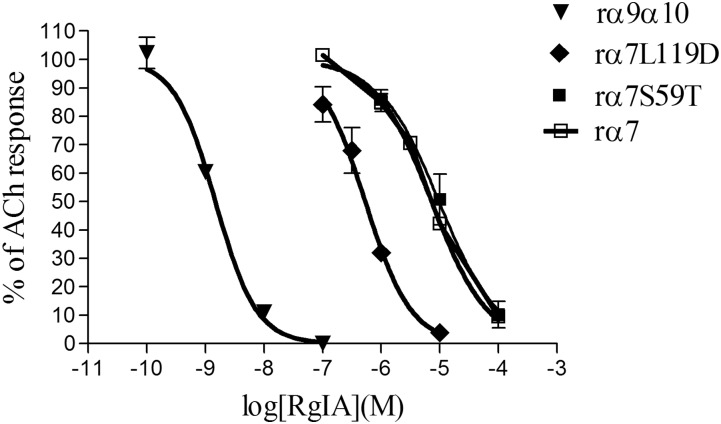
Fig. 3.
Dose-response curves for α-CTx RgIA on rat α9α10, rat α7, and rat α7 mutants α7S59T and α7L119D. There was an approximately 10-fold gain in potency of RgIA on the α7L119D receptor mutant. The concentrations of ACh used were 100 μM for α9α10 and 200 μM for α7 and α7 mutants. Data are mean ± S.E.M. from at least three separate oocytes.

