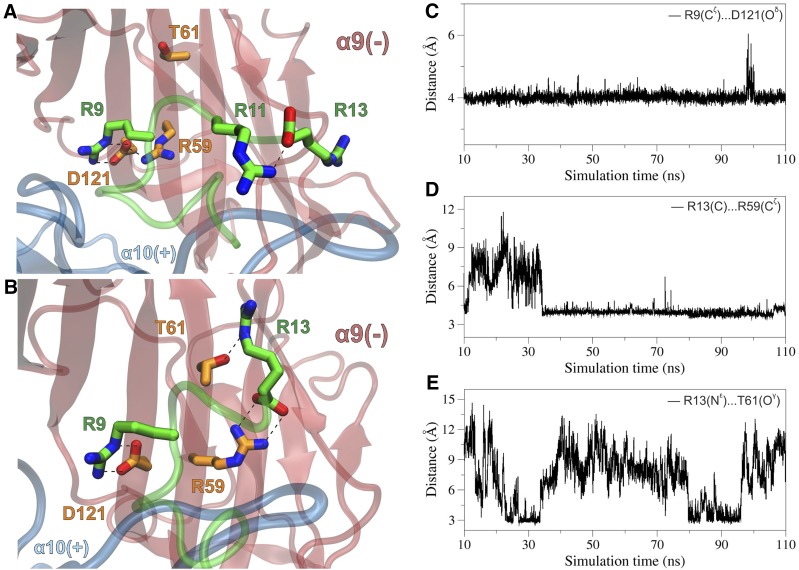
Fig. 7.
(A) Close-up view of the α-CTx–binding interface from a representative structure of the rat (α9)2(α10)3 ECD complex with α-CTx RgIA, illustrating the interactions between R9 of α-CTx RgIA and D121, which forms a stable salt bridge interaction with R59 at the α9(−) subunit. Residues from α9 subunit are shown with carbon atoms in orange, and all other colors are as in Fig. 5. (B) Close-up view of the second α10/α9–binding interface from a snapshot of the MDs of the rat (α9)2(α10)3 complex with α-CTx RgIA, illustrating the potential hydrogen-bonding interactions of R13 of α-CTx RgIA with R59 and T61 at the α9(−) subunit. (C) Plot of the distance between R9-Cζ and D121-Oδ from the first α10/α9 site as function of simulation time. (D) Plot of the distance between the C-terminus R13-C and R59-Cζ from the second α10/α9 site as a function of simulation time. (E) For the same site, plot of the distance between R13-Nε and T61-Oγ during the course of the MDs.

