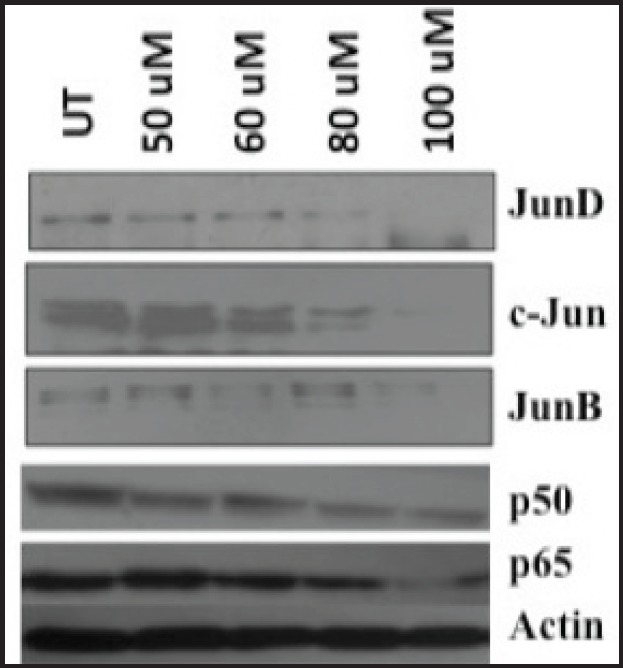
Figure 8. Immunoblotting showing differential expression pattern of proteins from AP-1 and NF-kB members in curcumin-treated cells (dose range = untreated to 100 uM). Decreased expression levels of c-Jun, JunD, JunB, p50, and p65 members after curcumin treatment. About 25–50 ug protein extracts of each treatment were resolved on an 8–20% gradient SDS-PAGE, electrotransferred on PVDF membrane and probed with different antibodies as described in method section. Equal total protein loading in each lane is confirmed by reprobing membrane with β-actin antibody. UT = Untreated. uM = micromolar.

