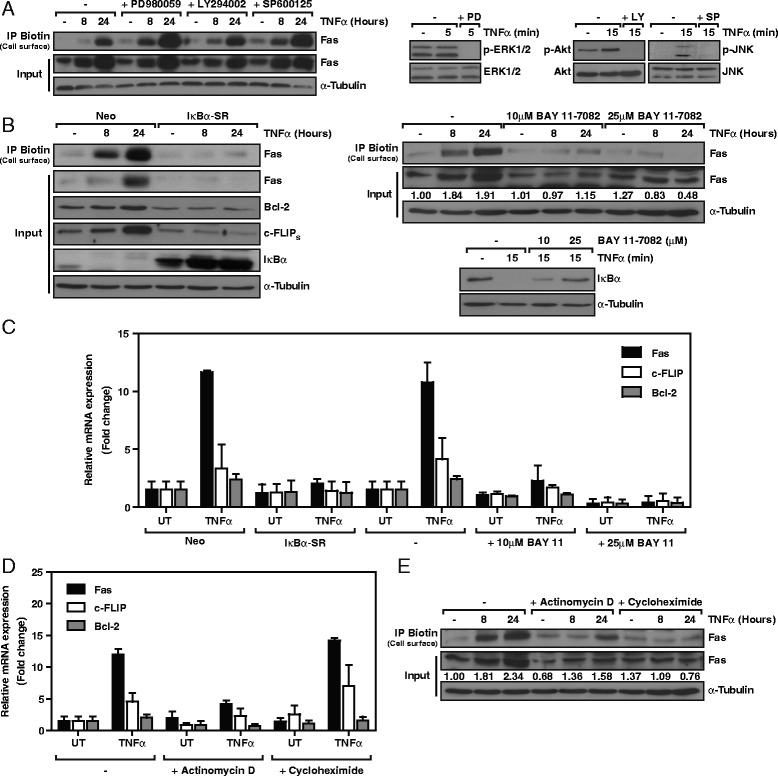
Figure 4.

NF-κB mediates TNFα-induced Fas expression and exposure to the cell surface. A. Left panel, SK-N-AS cells were treated with 25 μM PD980059, 20 μM LY294002 or 20 μM SP600125 prior to treatment with 100 ng/ml TNFα. At the indicated times, cell surface proteins were biotinylated, isolated, and analyzed by Western blot. Right panel, phospho-protein levels assessed by Western blot to confirm efficacy of PD980059 (PD), LY294002 (LY), and SP600125 (SP). B. Left panel, control (Neo) and SuperRepressor/SR-IκBα-infected SK-N-AS cells were left untreated (−) or treated with 100 ng/ml TNFα for 8 h and 24 h. Cell surface proteins were biotinylated, isolated, and analyzed by Western blot. Right panel, analysis of cell surface and total Fas levels. SK-N-AS cells were incubated with 10 μM and 25 μM of the NF-κB inhibitor BAY 11–7082 prior treatment with 100 ng/ml TNFα. Below, quantification of total Fas expression normalized vs. matching α-Tubulin controls. IκBα degradation Western blot confirmed the efficacy of BAY 11–7082. C. Control (Neo) and SuperRepressor/SR-IκBα-infected or control (−) and BAY 11–7082 pre-treated SK-N-AS cells were left untreated (UT) or treated with 100 ng/ml TNFα. mRNA levels of the indicated genes were assessed after 4 h by qRT-PCR. D. qRT-PCR assessment of the indicated genes, 4 h after 100 ng/ml TNFα treatment of SK-N-AS cells in combination with 20 nM actinomycin D or 1 μg/ml cycloheximide. E. Cell surface biotinylation assay in SK-N-AS cells pre-treated with 20 nM actinomycin D or 1 μg/ml cycloheximide and treated with 100 ng/ml TNFα for the indicated times. Protein levels were analyzed by Western blot. Below, quantification of total Fas expression normalized vs. matching α-Tubulin controls. All conditions were pre-incubated with 10 μM of the caspase inhibitor QVD to avoid cell death-related effects.
