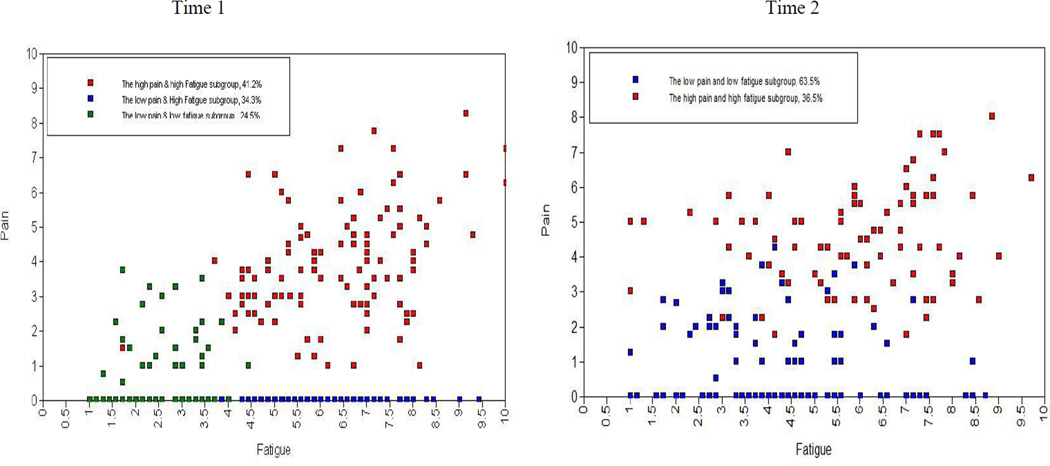
Figure 2.
Pain and Fatigue Subgroups Based on the Most Likely (expected a posteriori) Subgroup Membership of Each Respondent
Note: Intensity of each symptom is raw score and patients are classified based on the estimated model; The ranges of scores for fatigue and pain were 1–10; Higher scores indicated more intense symptoms.

