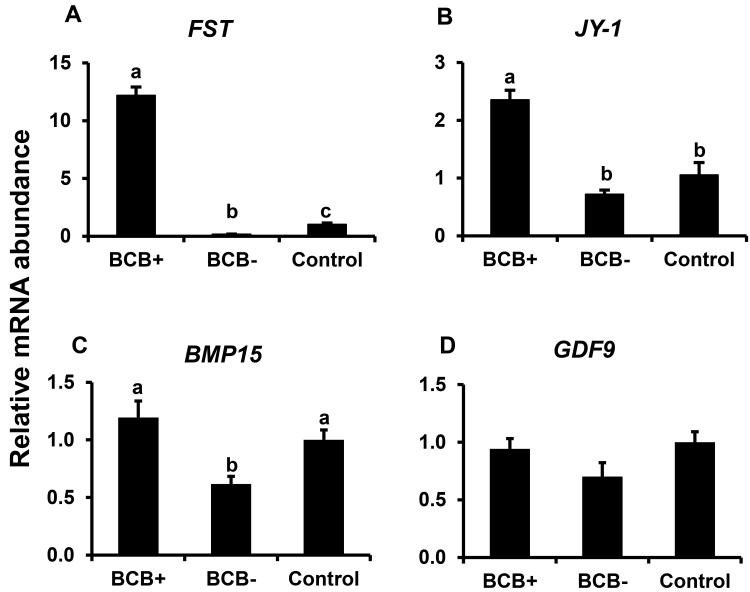
Figure 1.
Expression of FST (A), JY1 (B) BMP15 (C), and GDF9 mRNAs (D) in BCB-screened GV-stage bovine oocytes. Quantitative reverse transcriptase PCR analysis of mRNA abundance was performed on samples of control, BCB+ and BCB− GV-stage oocytes (n = 4 pools of 10 oocytes for each oocyte group). Data were normalized relative to abundance of endogenous control (RPS18) and are shown as mean ± standard error. Values with different superscripts across treatments indicate significant differences (P < 0.05).

