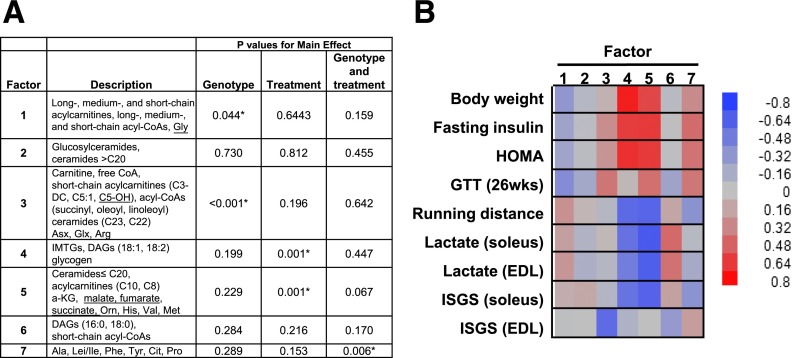
Figure 7.
PCA and factor associations with functional outcomes. PCA was used as a data reduction strategy for exploratory purposes. Factors comprised of strongly corrected metabolites were surveyed for potential relationships with measures of energy and glucose homeostasis (see research design and methods). A: Key metabolites in PCA factors 1–7 and the effect of genotype and treatment (Ex/CR) on each factor. Key metabolites within each retained factor (i.e., metabolites with factor load ≥|0.4|) and an overall description of each factor are presented. Underlined metabolites had a negative load score. *P > 0.05. DC, dicarboxylic, OH, hydroxyl. B: Heat map illustrating the positive (red) and negative (blue) associations between factors 1–7 and physiologic outcome measures. Glucose tolerance test (GTT) (26 weeks [wks]): blood glucose levels measured 120 min after an intraperitoneal glucose injection. ISGS, insulin-stimulated glycogen synthesis.

