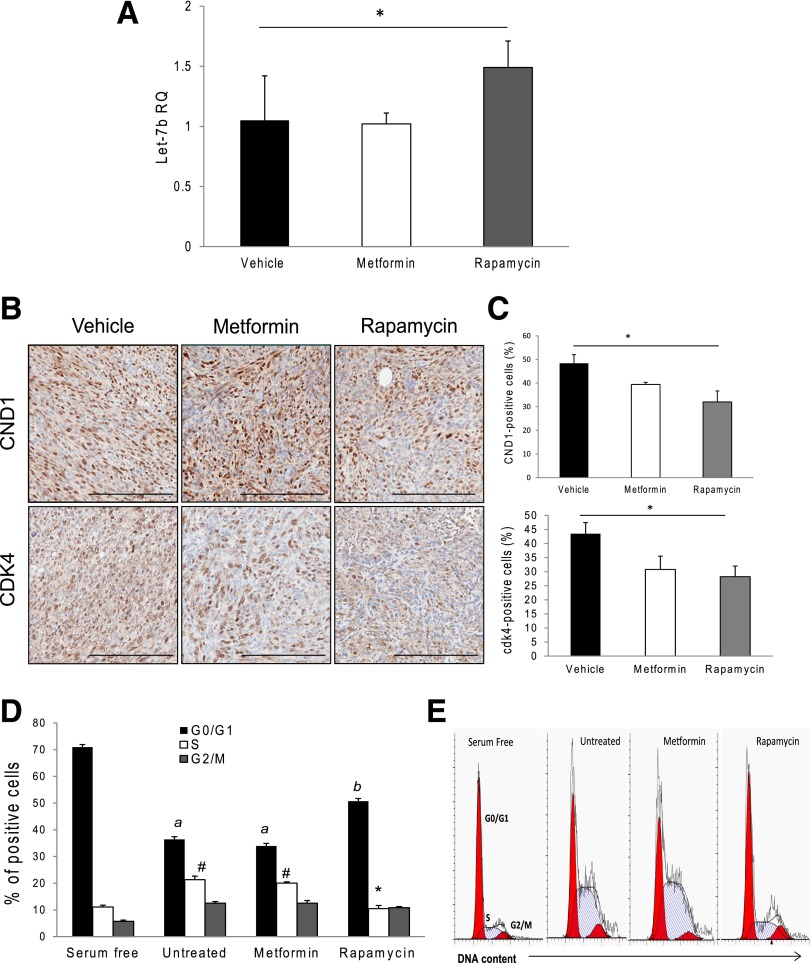
Figure 5.
Rapamycin increased let-7b level in pancreatic tumors and inhibited cell cycle progression. A: Bar graph representing mean let-7b mRNA expression in tumor tissues (n = 3–6 per group). The bar graph represents mean ± SEM. *P < 0.05 by Student t test. B and C: Representative images of tumors immunohistochemically stained for the cell cycle regulatory proteins cdk4 and cyclin D1 (B) and respective quantification of positively stained cells (n = 8 per group) (C). Scale bar represents 100 nm. D: Cell cycle analysis (PI staining) of Panc02 cells treated with metformin (0.5 mmol/L) or rapamycin (0.1 mmol/L) for 24 hours (n = 3 per treatment in six replicates). Values within each cell cycle phase with different letters (a,b) or symbols (#,*) are significantly different at P < 0.05. E: Histogram representation of the cell cycle phase distribution. The bar graph represents mean ± SEM. *P < 0.05 by one-way ANOVA. The white sphere in B (CND1 expression for the rapamycin-treated group) is the cellular outline of a large adipocyte because histological processing with organic solvents extracts the lipid content of cells.

