Figure 1.
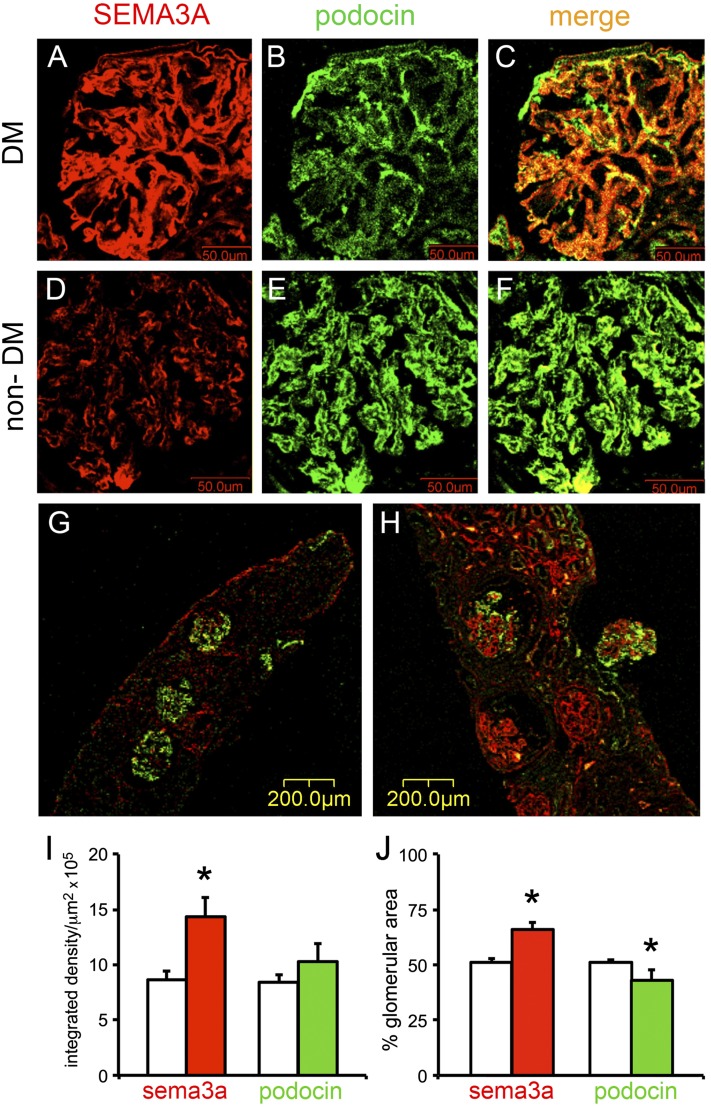
Podocyte SEMA3A is increased in human diabetic nephropathy. Dual fluorescent immunohistochemistry with SEMA3A and NPH2 antibodies was performed in frozen sections from human renal biopsies. A–C: Representative images from a biopsy with class IV diabetic nephropathy show a strong SEMA3A signal (A, red) localized to podocytes, as indicated by colocalization with podocin (B, green) shown in a merge (C, yellow/orange). Scale bars = 50 μm. D–F: Representative images from a nondiabetic kidney biopsy (a patient with hypertension and no evidence of renal pathology) show minimal SEMA3A signal localized to podocytes. Scale bars = 50 μm. G: Representative low-magnification image from nondiabetic kidney biopsy (MCD) shows minimal SEMA3A in three glomeruli, whereas podocin expression is intact. Scale bar = 200 μm. H: Representative low-magnification image from a diabetic kidney biopsy shows strong glomerular SEMA3A expression and variable colocalized podocin expression. Scale bar = 200 μm. I and J: Quantitation of immunofluorescent signals shows that SEMA3A increases approximately twofold in diabetic glomeruli (red bars) compared with nondiabetic glomeruli (white bars), whereas podocin (green bars) does not change or decreases slightly. Data are expressed as mean ± SEM immunofluorescent integrated density/μm2 (I) and percentage of glomerular area stained on immunofluorescence (J). All glomeruli present in the biopsies were included in this quantitative analysis. DM, diabetes mellitus.

