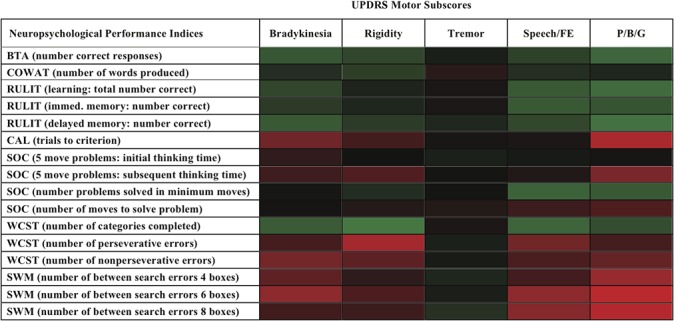
Fig 1. Heat map showing the relationships between cognitive test performance (based on correlation coefficients) and subscores from the Unified Parkinson’s Disease Rating Scale (UPDRS) motor scales.

Green denotes a significant negative correlation, red denotes a significant positive correlation and black denotes no significant correlation. The intensity of the color reflects the strength of the correlation.
