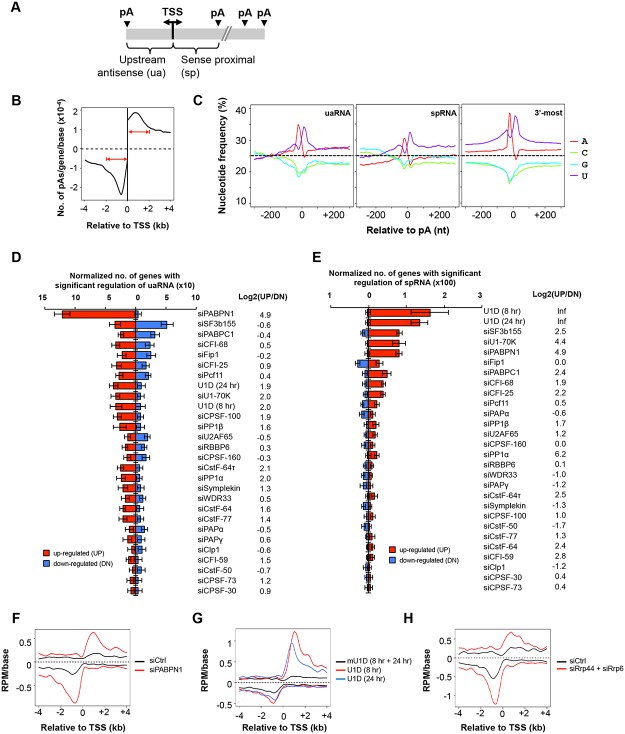
Fig 4. C/P events around the transcriptional start site (TSS).
(A) Schematic of C/P events around the TSS. uaRNA and spRNA are upstream antisense and sense proximal RNAs, respectively. (B) Distribution of uaRNA and spRNA pAs utilized in control C2C12 cells. In this study, we required that the pA of a uaRNA/spRNA was within 2 kb from the TSS, a uaRNA did not overlap with any known protein-coding genes, and the pA of an spRNA was not in the 3’-most exon or in a single-exon gene. (C) Nucleotide frequency profiles around pAs of uaRNAs (left) and spRNAs (middle) and around 3’-most pAs (right). Dotted lines indicate the 25% value. (D) Normalized number of genes with regulated uaRNA expression. Red and blue bars represent genes with upregulated (UP) and downregulated (DN) uaRNA expression, respectively. Log2(UP/DN) is log2(ratio) of the number of UP genes to the number of DN genes. All uaRNAs were combined and compared by SAAP with all sense strand transcripts whose pAs were beyond 2 kb from the TSS. Q-value < 0.05 (SAAP) was used to select genes with a significant uaRNA expression difference. Error bars are standard deviation based on 20 times of bootstrapping. Samples are sorted by the total number of genes with uaRNA expression change. (E) Normalized number of genes with regulated spRNA expression. Red and blue bars represent genes with upregulated (UP) and downregulated (DN) spRNA expression, respectively. All spRNAs were combined and compared to all sense strand transcripts whose pAs were beyond 2 kb from the TSS by SAAP. Q-value < 0.05 (SAAP) was used to select genes with significant spRNA expression difference. Error bars are standard error of mean based on 20 times of bootstrap sampling. Samples are sorted by the total number of genes with spRNA expression changes. Log2(UP/DN) is log2(ratio) of the number of UP genes to the number of DN genes. (F-H) Metagene plots of uaRNA and spRNA expression in siPABPN1 (F), U1D (8 hr and 24 hr, G), and siRrp44 + siRrp6 (H) samples. Expression is represented by reads per million (RPM, poly(A) site-supporting reads only) at pA positions.

