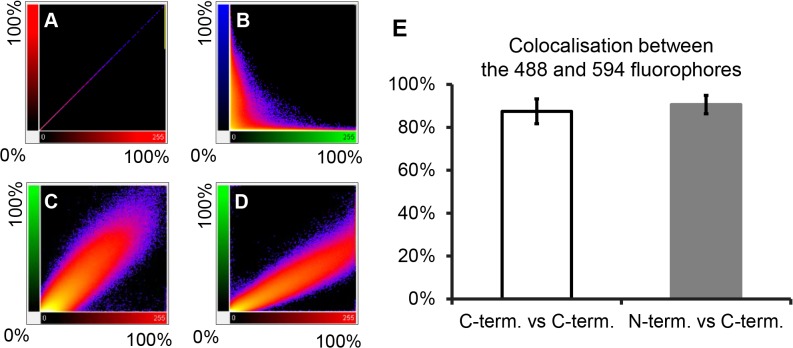
Fig 4. Quantitative analysis of colocalisation of the L protein N- and C-termini in infected cells.
Three 3D images of infected cells, prepared as described for Fig 3 and each composed of eight focal slices, were analysed by the ImarisColoc function of the Imaris x64 version 7.4.2 software, using automatic threshold determination. (A-D) 2D plots of light intensity for each voxel in the 3D image for different pairs of channels for different pairs of antibodies: (A) plot of single channel against itself to illustrate theoretically perfect colocalisation; (B) plot of cytoplasmic L protein staining (green) vs nuclear DNA staining (blue) to illustrate perfect absence of colocalisation; (C) plot of actual perfect colocalisation, from staining infected cells with the same antibody (anti-L(CT)) labelled with two different fluorophores (Zenon 488 (green) or with Zenon 594 (red)); (D) plot of signal intensities given by anti-L(NT) and anti-L(CT). (E) Histogram showing average percentage of colocalisation (expressed as average “Pearson's coefficient in dataset volume”) between 488 and 594 signals from three analysed 3D images for each of control (infected cells stained only with anti-L(CT)) and experimental (infected cells co-stained with affinity purified anti-L(NT) and anti-L(CT)) samples. Error bars represent standard deviation.

