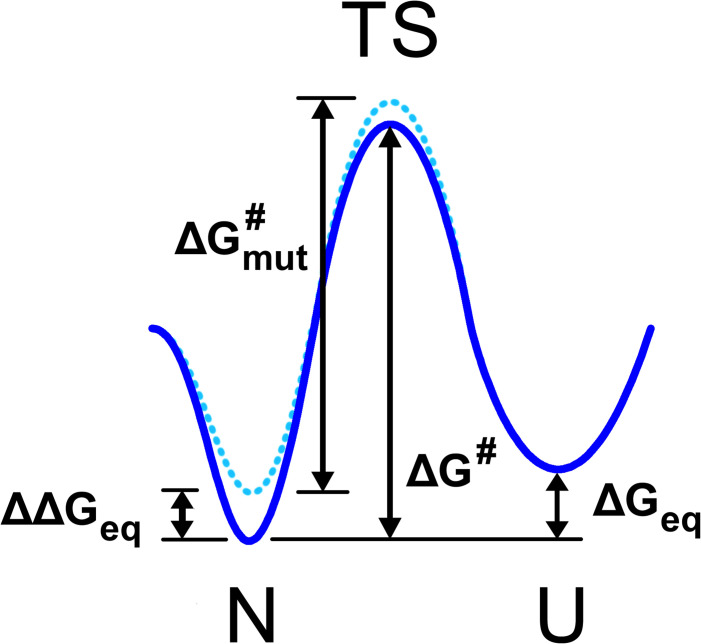
Fig 1. Two state diagram depicting the protein native state N, transition state TS, and unfolded state U.
The WT energy landscape is shown in solid blue and the mutant energy landscape in dotted blue. The difference in free energy between WT folded and unfolded states, ΔGeq, the change in this quantity upon mutation, ΔΔGeq, and the height of the transition state barrier relative to the native state for WT (ΔG#) and mutant () are labeled.

